A Handful of Disparate Findings on Social Dominance Orientation
By Jon Green (@_Jon_Green)
When we drafted our pre-election survey, we wanted to include a variety of attitudinal measures that social scientists use to explain meaningful variation in political attitudes and behaviors. These ranged from basic feeling thermometers, which ask respondents to rate how warm or cold they feel toward people in various social groups, to multi-item scales such as racial resentment or hostile sexism that are designed to capture other specific constructs of interest.
We included one of these measures, social dominance orientation, due to its basis in the social psychology literature as a measure of general comfort with group inequality. It also recently featured in a scale political scientists Diana Mutz termed “status threat” in an influential paper on voting behavior in the 2016 election, which she constructed to tap into various anxieties about international competition and cultural change. In other words, social dominance orientation doesn’t measure racism or sexism, per se, but people who score highly in social dominance are less likely to be sensitive to racism or sexism -- and this likely has political consequences.
For reference, here is the social dominance orientation battery (when constructing the scale, the third item is reverse-coded):
There are many kinds of groups in the world: men and women, ethnic and religious groups, nationalities, political factions. How much do you support or oppose these ideas about groups in general? For each statement, please state whether you strongly agree, somewhat agree, neither agree nor disagree, somewhat disagree, or strongly disagree.
In setting priorities, we must consider all groups
We should not push for group equality
Group equality should be our ideal
Superior groups should dominate inferior groups
The list below shows the mean levels of social dominance across various demographic characteristics that we might care about. For some, such as partisanship, ideology, and identification as a born-again Christian, there are clear patterns. For other demographics, such as race and age, the differences are less stark. In general, social dominance polarizes by party and ideology (conservatives and Republicans have the highest levels of social dominance, on average, while Democrats and liberals have the lowest.
Mean levels of social dominance by demographic characteristic (0-1 scale):
Male: 0.3
Female: 0.23
White: 0.27
Non-White: 0.22
Non-College: 0.28
College: 0.24
Born-Again Christian: 0.34
Other Religious Affiliation: 0.24
Democrat: 0.13
Independent: 0.28
Republican: 0.4
Liberal: 0.1
Moderate: 0.24
Conservative: 0.41
Age 18-29: 0.21
Age 30-39: 0.24
Age 40-49: 0.24
Age 50-64: 0.26
Age 65+: 0.28
Income <$50k: 0.24
Income $50-100k: 0.27
Income >$100k: 0.25
Income declined to respond: 0.32
We also included the following batteries that, directly or indirectly, measure attitudes toward particular social groups. These include:
fire2: two items from the recently-developed Fear, Institutional Racism, and Empathy (FIRE) battery tapping into comfort with systemic racial inequality
rr: three items from the Racial Resentment scale, a traditional measure of symbolic racism in political science
threat43: a series of questions asking respondents how they feel about the prospect of a majority of the United States population being non-white by the year 2043
sexism: three items from the Hostile Sexism battery, a standard measure of gender attitudes in political science
wbFTdiff: the difference in respondents’ reported feelings toward whites and blacks
wbINTdiff: the difference in how intelligent respondents reported whites and blacks as being in general
wbLAZYdiff: the difference in how lazy respondents reported whites and blacks as being in general
We begin by simply plotting all of these scales’ correlations with one another. As the correlation plot shows, social dominance (sdo), racial resentment, the two-item FIRE battery, hostile sexism, and status threat all correlate relatively strongly with one another. Whites’ affective preference for whites over blacks correlates slightly less well, and the two stereotyping measures correlate more strongly with each other than they do with the less overt measures of group attitudes.

Correlations between attitudinal constructs of interest
Looking at social dominance orientation in particular, the scale correlates at .6 with the two-item FIRE scale and racial resentment, at .59 with immigration threat, and at .54 with hostile sexism. While these correlations are not quite strong enough to consider social dominance to be explaining variation in the same sorts of attitudes -- we can’t consider social dominance a full proxy for racism or sexism -- it is clear that these constructs are related to one another. This is less the case for the more overt measures of animus and stereotyping, with social dominance carrying correlations of .4, .27, and -.35 with feeling thermometer difference, intelligence difference, and laziness difference, respectively.
Next, we examine the relationship between social dominance orientation and policy views. To do this, I specified a series of logistic regressions using social dominance orientation as the key independent variable and binarized support for each policy item we asked in the survey (as well as a similar, non-policy item regarding whether people should be more sensitive toward marginalized groups in how they talk) as the outcome variables, subsetted to white and non-white respondents, respectively. Each model controls for political identity variables -- partisanship and ideology -- as well as demographic variables age, income, whether the respondent holds a college degree, whether the respondent identifies as a born-again Christian, and whether the respondent reports being unprepared for unexpected financial distress.
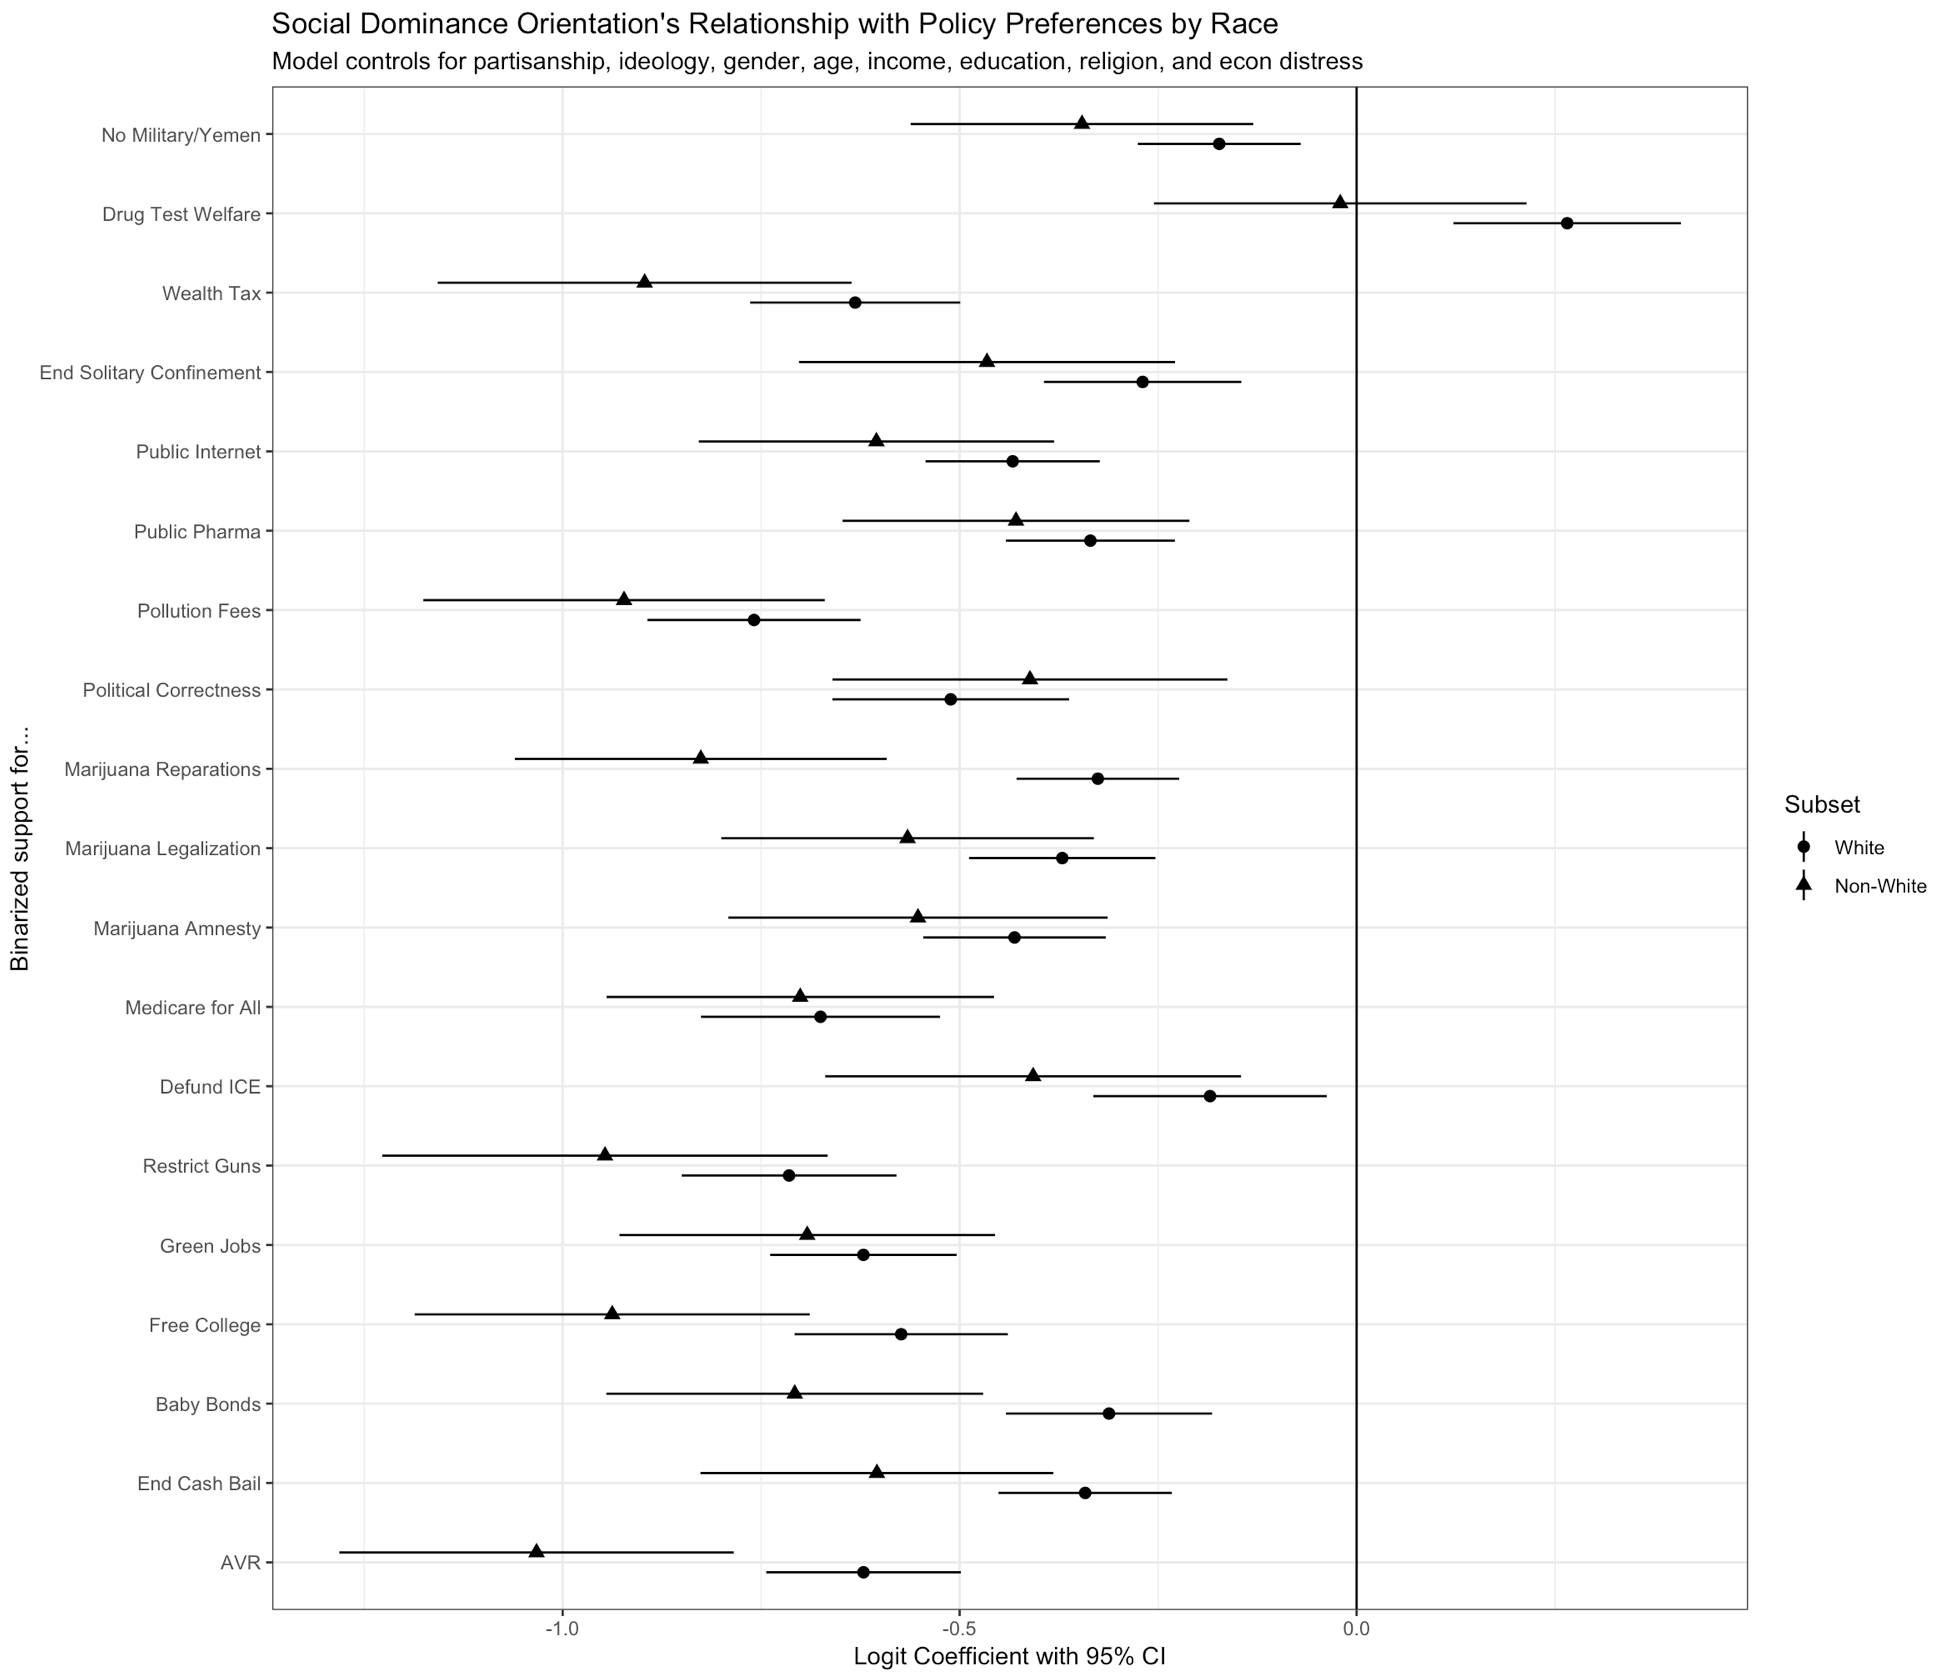
Logit coefficients associated with a one standard deviation increase in social dominance orientation.
As the coefficient plot shows, social dominance is consistently associated with less liberal/more conservative preferences to a statistically significant degree, and operates similarly among white and non-white respondents in most cases. The only case in which social dominance orientation is not meaningfully associated with policy attitudes is with non-whites’ attitudes toward drug testing welfare recipients. Interestingly, the relationship between social dominance and policy support is present even among policies that don’t obviously implicate group inequality, such as automatic voter registration and a public option for internet access.
There are a variety of ways one could interpret these findings. To speculate on one, it looks, to me, like social dominance orientation is functioning here as a form of ideological reasoning that goes beyond the traditional seven point liberal/conservative self placement measure of ideology -- included in the above models as a categorical control. Recent scholarship in political science argues that, for most citizens most of the time, ideology is a social identity as much as it is a way of thinking about the world. Social dominance orientation doesn’t implicate our identities in the same way, and as a result may provide additional information about our worldviews.
Jon Green (@_Jon_Green) is a Ph.D. candidate at Ohio State and co-founder of Data for Progress.