
Millennials and the 2018 vote
By John L. Ray (@johnlray), YouGov Blue
Each election, the millennial generation becomes a larger share of the electorate. As millennials move into adulthood, they will become increasingly consistent voters. It has been widely assumed by commentators that as millennials grew older, they might become more conservative. We do not find evidence for this. In addition, voting in the United States has increasingly been polarized by age. As recently as 2000, the parties split both the youth vote and the over 65 vote. In 2018, millennial voters reported they clearly sided with Democrats and progressives at the ballot box and on most of the big policy ideas of our time. Here, we look at how millennial voters compare to those of other generations, and the preferences of millennials overall.
Who are millennials?
We follow the Pew Research Center’s definition of a millennial as someone born after 1980 (though we also include voters born between 1997 and 2000 in this group, whom Pew classifies as being their own generation, since they are too small a fraction of the sample to analyze separately). Including the weights computed for respondents who took the Data for Progress module, there were 635 millennials and 2,580 non-millennials in our sample.
Following the Pew Research Center’s coding of generations, we coded our respondents into groups by age as follows:
Respondents between the ages of 18-37 were grouped as “Millennials,”
Respondents between the ages of 38-53 were grouped as “Generation X,”
Respondents between the ages of 54-72 were grouped as “Baby Boomers,” and
Respondents over the age of 72 were grouped as “Silent Generation”
Who are Millennial Voters?
Perhaps unsurprisingly, across age brackets, Millennials were the most likely to have cast a ballot for the Democratic candidate in their respective House districts. Fully 67 percent of Millennials chose the Democratic candidate, compared to just 44 percent of Silent Generation voters in a year in which Democratic House candidates averaged 53 percent of the national two-party vote share. The following chart demonstrates the vote share for House Democratic candidates in their respective districts for the four generations.

Similarly, there was a noticeable partisan breakdown in 2016 Presidential vote choice across the age brackets in our sample. Forty-six percent of Millennials reported voting for Hillary Clinton vs. just 23 percent who reported they voted for Donald Trump. Far higher than other age brackets in our sample, 15 percent of Millennials reported they didn’t vote and 15 percent reported voting for another candidate.
Across the age brackets in our sample, 43 percent of Generation X respondents and 44 percent of Baby Boomer respondents voted for Hillary Clinton, compared to just 37 percent of Silent Generation respondents. Millennial respondents were by a significant margin the most likely to have reported not voting in 2016, even accounting for those who would have been too young to vote at the time.. The following plot presents Presidential vote breakdowns across the age brackets in our sample.

Trump approval
Similarly, respondents across age groups reported favoring Trump at different levels with Millennials at the lowest end of the spectrum and Silent Generation respondents at the highest. Trump’s approval rating among Millennials was just 30 percent in the weeks prior to the 2018 midterm election among respondents in our sample. His approval among Generation X respondents was about 45 percent, 53 percent among Baby Boomers, and 55 percent among Silent Generation respondents. Across all the age groups, those who were “unsure” of their opinion of Trump constituted a negligible share of the sample: Just 3 percent of Millennials, 1 percent of Generation X respondents, and less than 1 percent of Baby Boomer and Silent Generation respondents reported they were “not sure” how they felt about Donald Trump.
The following figure plots the breakdown of Trump approval by the generation bins in our sample. The bins range from Millennials (18-37+) to Silent Generation (age 73+) responses. The portions of the bars shaded in blue represent disapproval of Trump. The portions of the bars shaded in red represent approval of Trump. The portions shaded gray represent those who report they are “not sure.”

Party identification
The following figure plots self-reported party identification for the respondents in our sample by age group. Notably, the Republican Party is the least preferred response among respondents in the Millennial and Generation X bins. Just 22 percent of Millennials report identifying with the Republican Party, compared with 26 percent who identify as Independents. Forty-three percent identify as Democrats. The 21-point party identification gap among Millennials between the Democratic Party and the Republican Party is more than twice as severe as the 8-point party identification gap among Democrats and Republicans in the Silent Generation respondents in our sample.

With the help of progressive data and analytics firm Catalist, we were able to classify each of our respondents as living in a rural, suburban, or urban area in the United States. Across the age bins our sample, Millennials were the least likely to report being born-again and were the most likely to live in urban areas. Just 23 percent of Millennials identified as being born-again, from 32 percent among both Generation X and Baby Boomer respondents in our sample. In contrast, 33 percent of Millennials reported that they lived in an urban area, compared with 27 percent, 26 percent, and 25 percent respectively for Generation X, Baby Boomer, and Silent Generation respondents. While large pluralities across generation hold born-again status, that share is lower among younger respondents, while the share of those who report living in cities is higher among young respondents.

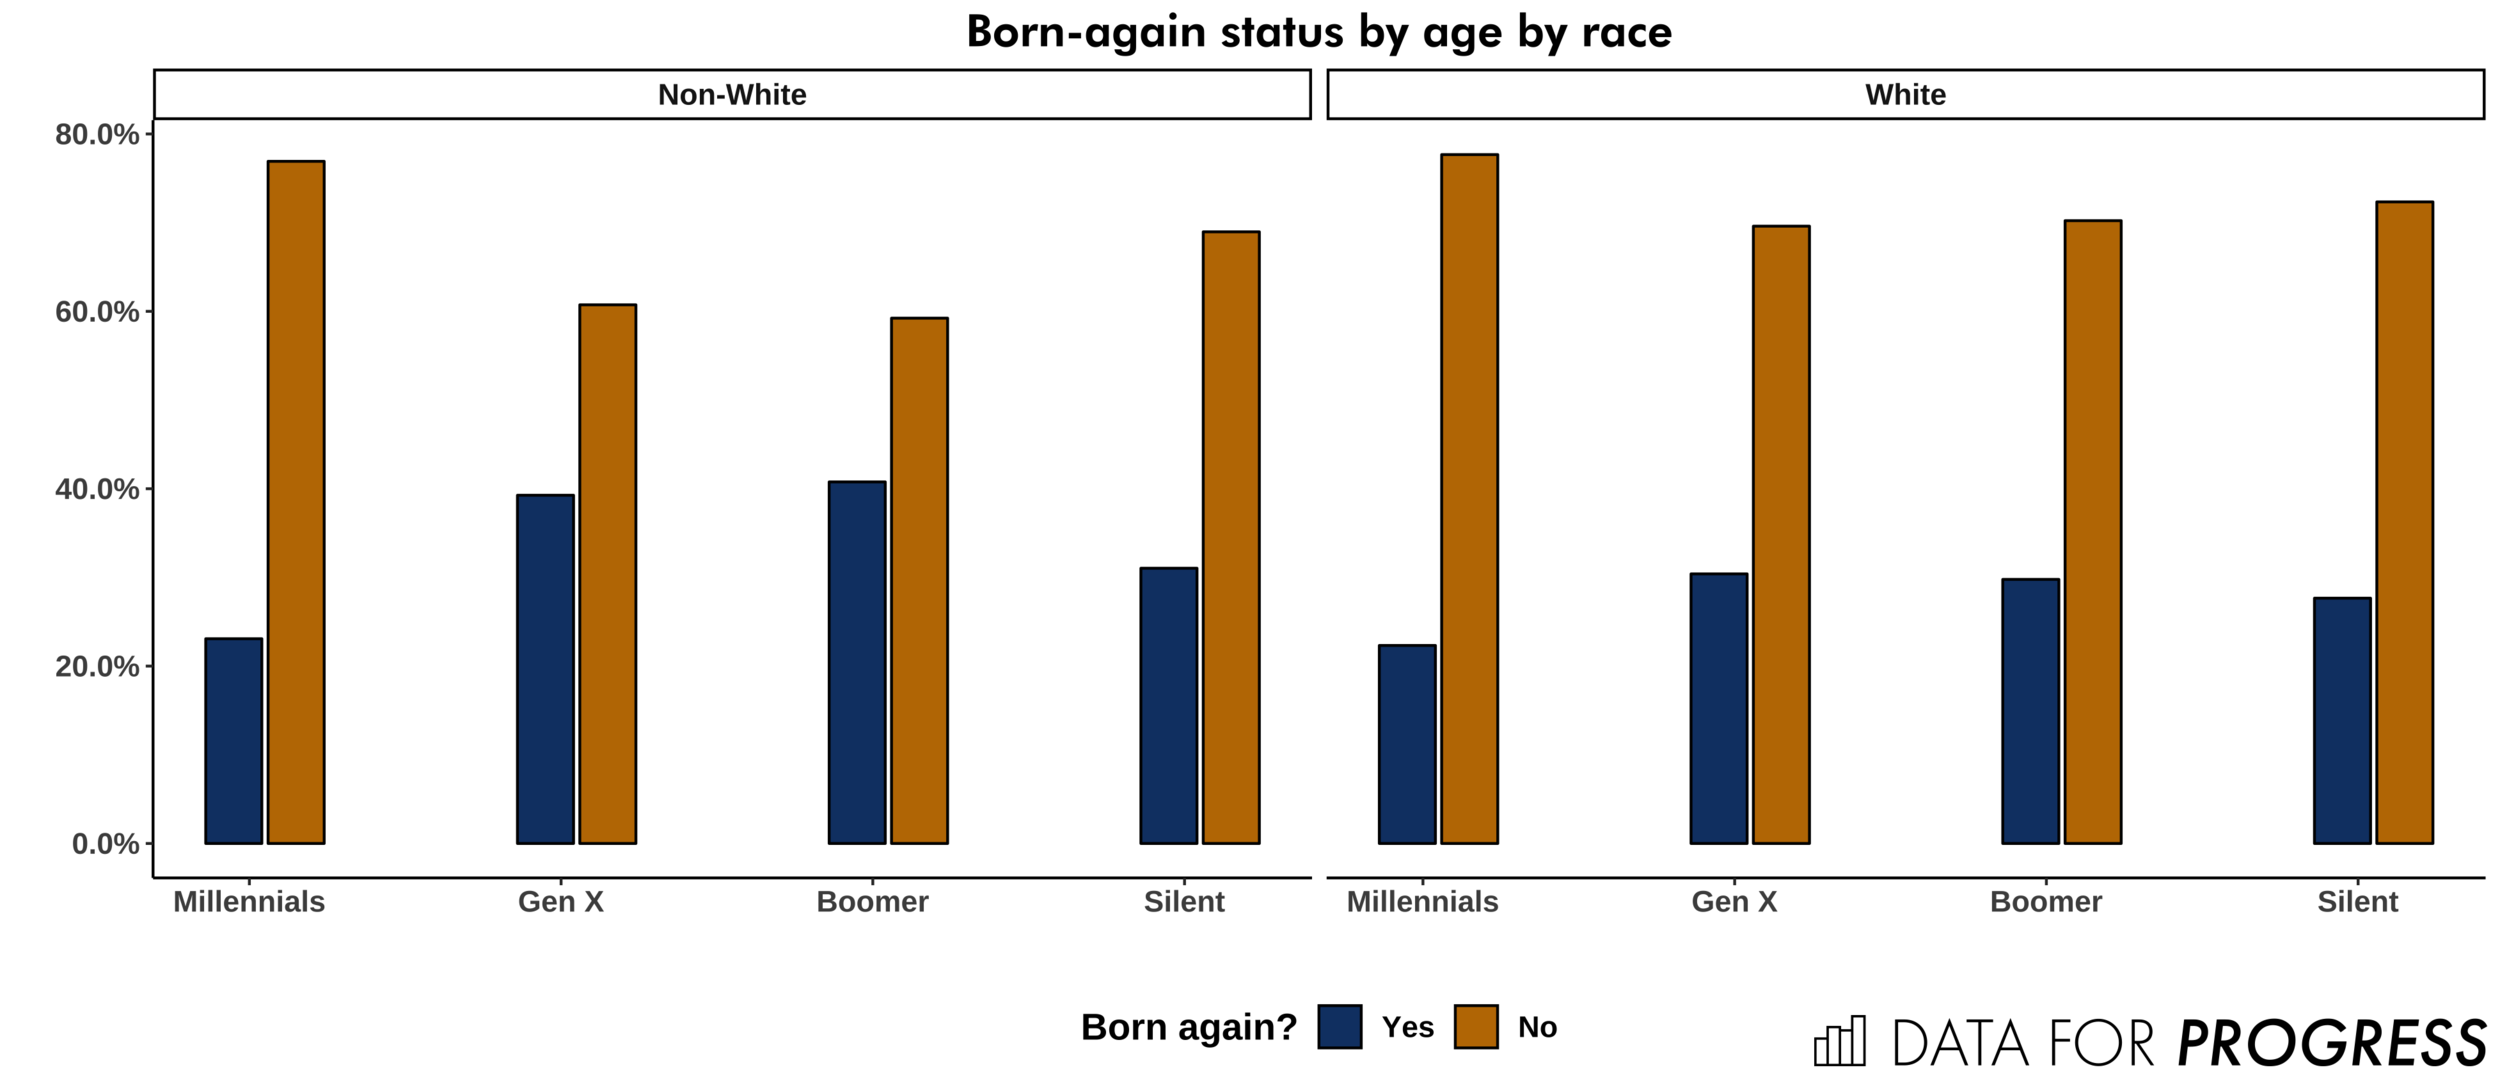
Self-reported born-again status is in decline across the white/non-white breakdowns across age and born-again status in our sample. 22 percent of white Millennials in our sample reported identifying as born-again, down from 30 percent of Generation X respondents, 30 percent of Baby Boomer respondents, and 28 percent of Silent Majority respondents. At the same time, just 23 percent of non-white Millennials in our sample reported identifying as born-again, down from 39 percent of Generation X non-white respondents, 41 percent of Baby Boomer non-white respondents, and 31 percent of Silent Generation non-white respondents.
The following figure breaks this down by age bracket and race. The blue bars represent respondents who report not identifying as born-again, while the cream-colored bars represent respondents who identified as born-again. The pane on the left represents that breakdown among respondents that were non-white, and the pane on the right represents that breakdown among white respondents.
Self-reported emotions toward voting in November
Early in the survey, respondents were asked about which emotions motivated their voting behavior in November. Specifically, respondents were asked,
Now, when you think about voting in the upcoming elections for Congress this November, which of the following emotions best describe why you are voting? You may choose up to three responses.
Followed by a list of options, offered in randomized order, including the following:
Angry
Interested
Worried
Hopeful
Frustrated
Excited
Confident
Helpless
Depressed
Proud
Happy
Confused
Indifferent
Bored
Powerful
Powerless
Not sure (always came last)
Across the generation bins in our survey, respondents generally reported a similar set of motivating emotions concerning their November 2018 vote. Anger, depression, frustration, hope, and worry predominated the emotion set selected by respondents across generation bins.

Linked fate and millennials
In the Data for Progress module of this survey, respondents were asked an item corresponding to the concept of “linked fate.” Linked fate is the sense that what happens to those of one’s own race/ethnicity has an effect on what will happen to oneself. Specifically, respondents were asked:
Please indicate the extent to which you agree with the following statement: “What happens generally to [people of respondents’ race] in this country will have something to do with what happens in your life.”
Across the full sample, 16 percent strongly agreed, 34 percent somewhat agreed, 36 percent neither agreed nor disagreed, 8 percent somewhat disagreed, and 6 percent strongly disagreed.
Across race and millennial/non-millennial status, Black millennials and non-millennials were within the item-level standard error of each other, indicating no difference in levels of self-reported linked fate (54 percent +/- 11 percent of millennial Blacks vs. 62 percent +/- 6 percent of non-millennials Blacks). Among Latinos, 62 percent +/- 12 percent of Millennials vs. 40 percent +/- 8 percent report feeling linked fate, a significant difference. Additionally, millennial whites were more likely to report feelings of linked fate compared to non-millennial whites to a significant degree. 56 percent of millennial whites +/- 4 percent compared to 48 percent +/- 2 percent of non-millennial whites reported feelings of linked fate in our sample.
The following figure plots self-reported linked fate across race/ethnicity and millennial/non-millennial status in our sample. Within each pane, the bar on the lefthand side represents the quantity of interest for millennials, while the bar on the right represent the quantity for non-millennials. The black bars indicate the standard errors of the estimate associated with each quantity.

Populism, racial animus, and the House vote
Additionally, respondents were asked several items corresponding to the notion of racial animus, a concept born in the political psychology literature to measure racist attitudes in respondents without requiring them to explicitly state racial animus, which respondents are thought to be averse to doing (though some recent research calls this assertion into doubt). Specifically, respondents were asked:
Please indicate the extent to which you agree with each of the following statements. Generations of slavery and discrimination have created conditions that make it difficult for African Americans to work their way out of the lower class.
and,
Please indicate the extent to which you agree with each of the following statements. Irish, Italian, Jewish, and many other minorities overcame prejudice and worked their way up. Blacks should do the same without any special favors.
and,
Please indicate the extent to which you agree with each of the following statements. White people in the U.S. have certain advantages because of the color of their skin.
and,
Please indicate the extent to which you agree with each of the following statements. Racial problems in the U.S. are rare, isolated situations.
and,
Please indicate the extent to which you agree with each of the following statements. I am angry that racism exists.
using these items, we created a scale of racial animus ranging from zero to five. Respondents would be given a “1” for each of the items they disagreed or strongly disagreed with among the first, third, and fifth items in the scale and a “0” otherwise. Respondents would be given a “1” for each of the items they agreed or strongly agreed with among the second and fourth items in the scale and a “0” otherwise. The scale is simply the sum of their coded responses to the five items.
Using the populism scale and a battery of general demographic items, we also attempted to predict support for Donald Trump in 2016 and Congressional Republicans in 2018. We compared these results with similar predictions using respondents’ self-reported levels of racial animus.
The following figures break down the racial animus scale by our our-category age variable (18-37 or Millennial, 38-53 or Gen X, 54 to 72 or Baby Boomer, and 73+ for Silent Generation). Across these comparisons, only Millennials stand out: While each of the other age bins are within the quantity standard error of one another, Millennials score lower on the racial animus scale than the other three groups. Compared to an average of roughly 2 (out of a maximum of 5) for each of the other age groups, Millennials averaged about a 1.74 on the racial animus scale. The following figure plots racial animus by each of the four age groups.

Though perhaps not by as much as some might think, Millennial respondents score lower on this measure of racial attitudes than other generations. Interestingly, Millennials are the only statistically distinct age group on this measure: Each of the other age groups were within the margin of error of one another, while Millennials were statistically lower on this measure than each of the other groups.
Support for Trump vs. support for the Republican Party
There is some speculation as to whether the role of racism in electing Donald Trump is now a permanent fixture of the Republican Party, or if Trump and his racist rhetoric are momentary flukes of a party capable of surviving his Presidency. To investigate this question, we asked Republican respondents in our survey to evaluate whether, overall, they were more supportive of Donald Trump or the Republican Party.
Our results present a mixed picture of the future for the Republican Party. On the one hand, the next generation of Republican voters are less likely to say they support Donald Trump more than the Republican Party than those of other generations. On the other hand, the margins do not bode well for the Republican Party overall. 30 percent of millennials prefer the GOP over Trump “somewhat” or “strongly,” while 65 percent prefer Trump “somewhat” or “strongly.” By comparison, 81 percent of Silent Generation respondents and 80 percent of Baby Boomer respondents reported supporting Donald Trump over the GOP.

More work is needed to fully explore the meaning of this result. For context, it is not atypical for partisans to view an in-party President more favorably than their party brand overall. There is little public data on respondents who are required to choose one or the other, but considering individual legislators are generally more popular than parties up and down the ticket, we currently lack the longitudinal context necessary to rule whether Trump is atypically preferable to his home party compared to other Presidents.
General differences and Millennial status
Though millennials report lower levels of racial animus than other generations, we do not find a radical shift in the type of neighborhoods millennials report living in compared to other generations. Late in the survey, respondents were asked to rate the perceived diversity of their neighborhoods on a ten-point scale from “more homogenous” to “more diverse.” The following figure plots responses to the scale for millennials and non-millennials, ranging from “more homogeneous” to “more diverse.”

Demographics of interest: Millennials vs. non-Millennials
The following figures present demographic summaries of respondents by their generation bins, which include Millennial, Generation X, Baby Boomer, and Silent Generation. Unsurprisingly, only 25 percent of millennials reported having an income above the national median, compared to 32 percent of silent generation respondents. The two youngest generations in our sample are also the most diverse, with 12 percent of the Millennial portion of the sample and 15 percent of the Generation X portion of the sample being Black, compared with 10 percent of Baby Boomers and 8 percent of Silent Generation respondents being Black. In our sample, 13 percent of Millennial respondents were Latino, compared with 9 percent of Generation X respondents, 6 percent of Baby Boomer respondents, and 4 percent of Silent Generation respondents. Among our sample of 2018 voters 39 percent of Millennials, 34 percent of Generation X respondents, 35 percent of Baby Boomers, and 40 percent of Silent Generation respondents had a college degree or above.

Among respondents in our sample, across generation groups, 47 percent of respondents identified as being “very liberal,” along with 34 percent of Generation X respondents, 30 percent Baby Boomer respondents, and 24 percent of Silent Generation respondents. Among respondents in our sample, which included those who were most likely to vote in 2018, 92 percent of Millennials reported that they voted “very often” as opposed to “somewhat often,” “not too often,” or “not often at all.” 95 percent of Generation X respondents, 98 percent of Baby Boomer respondents, and 99 percent of Silent Generation respondents in our 2018 voter sample reported they voted often.

Across the age buckets in our sample, 23 percent of Millennial-age respondents reported that they were “born-again.” 33 percent of Generation X respondents reported that they were born-again. 32 percent of respondents in the Baby Boomer generation reported they were born-again, as did 28 percent of Silent Generation respondents.
Among respondents in our sample, Millennials were slightly more racially liberal towards Blacks and Latinos than respondents in other age brackets. Respondents in the Millennial age bracket rated Latinos at 75 out of 100, compared to 73 for Generation X respondents, 74 for Baby Boomer respondents, and 74 for Silent Generation respondents. Respondents in the Millennial age group rated Blacks at an average 75 out of 100, and on average 74 out of 100 for Generation X respondents, 75 out of 100 for Baby Boomer respondents, and 75 out of 100 for Silent Generation respondents. At the same time, Millennial respondents rated “white people” at just a 67 out of 100, compared to a 72 for Generation X respondents, 77 for Baby Boomer respondents, and 81 for Silent Generation respondents.

Policy items
In the policy items section of our survey, respondents were asked to rate their level of support for “defunding Immigration and Customs Enforcement (ICE).” Across the age bins in our sample, respondents were more likely to report that they opposed the motion than supported with the exception of Millennials, who were roughly tied in their level of support for abolishing ICE (36 percent somewhat or strongly supporting abolition vs. 37 percent somewhat or strongly opposing abolition). For context, while shrinking government is often broadly popular, abolition of specific government programs usually is not.
Abolish ICE
Across age groups, the share of respondents reporting that they neither supported nor opposed abolishing ICE was high relative to that of other policy items. 17 percent of Millennials, 17 percent of Generation X respondents, 14 percent of Baby Boomer respondents, and 14 percent of Silent Generation respondents reported neither opposing nor supporting abolishing ICE. There is still room for general persuasion on this policy item.

Corporate Pollution fees
In contrast, corporate pollution fees -- a somewhat well-known component of much of the Green New Deal discussion -- enjoyed broad support across age brackets in our sample. 70 percent of respondents in the Millennial age bracket, 66 percent of Generation X respondents, 65 percent of Baby Boomer respondents, and 66 percent of Silent Generation respondents strongly or somewhat supported the item in question.

Demographic change
While previously in our analysis we found a strong role for partisanship in predicting attitudes towards the role of demographic change in the future of politics and the economy, we do not find a similar divide across age groups. For the post-demographic change item that read, “[demographic change] ... means there will not be enough jobs for everybody,” we found that 23 percent of Millennials, 30 percent of Generation X respondents, 31 percent of Baby Boomer respondents, and 34 percent of Silent Generation respondents reported agreeing or strongly agreeing with the statement.
The generation most likely to be affected by future demographic change reports being the least concerned that this change will accrue to their economic detriment. As demonstrated above, however, partisanship is a stronger predictor of attitudes towards future demographic change than generation.

Reinforcing the Border
Across the age groups within our sample there were strong divides on the issue of reinforcing the border. Specifically, respondents in our sample were asked whether they strongly agreed, somewhat agreed, neither agreed nor disagreed, somewhat disagreed, or strongly disagreed with the statement with “the following proposal addressing immigration: Increase border security by building a fence along part of the US border with Mexico.”
The following plot summarizes the generational differences in agreement or disagreement with this statement. Just 32 percent of Millennials agree with this statement strongly or somewhat, compared to 54 percent of Millennials who disagree strongly or somewhat. 46 percent of Generation X respondents somewhat or strongly agree with the statement, along with 52 percent of Baby Boomers and 60 percent of Silent Generation respondents. From the top to the bottom of the generation bins in our data, support for continuing to fortify the border fell by roughly half.

White Privilege
Perhaps surprisingly, there were not strong generational divides in ignoring the role of white privilege in American life. About midway through the survey, respondents were asked whether they strongly agree, somewhat agree, neither agree nor disagree, somewhat disagree, or strongly disagree with the statement, “White people in the U.S. have certain advantages due to the color of their skin.” This item forms one of the five-item Racial Resentment scale reported previously in this memo.
In our sample, 63 percent of Millennials somewhat or strongly agreed with this statement, with just 27 percent disagreeing. 51 percent of Generation X respondents, 51 percent of Baby Boomer respondents, and 50 percent of Silent Generation respondents also somewhat or strongly agreed with this statement. Contrary to some stereotypes that may be held about the racial attitudes of different generations, there was for the most part little variation across the sample’s racial attitudes by generation.

John Ray (@johnlray) is a Senior Political Analyst at YouGov Blue.
As part of our What The Hell Happened Project, Data for Progress commissioned a survey of 3,215 voters from YouGov Blue that was fielded October 27th through November 7th, which was weighted to be nationally representative of 2018 voters. The survey margin of error was +/-2 percent.