
The Urban/Suburban/Rural Divide in the 2018 Midterms
By John L. Ray (@johnlray) and Sean McElwee (@SeanMcElwee)
Intro
Much ink has been spilled about America’s supposed geographic divide, about the intrinsic differences between the urban, suburban, and rural voters’ policy preferences. As part of the What The Hell Happened? project, we explored the demographics, backgrounds, beliefs, and policy preferences of 3,215 voters across the country in a survey fielded with YouGov Blue in the weeks before election day 2018.
With the help of our friends at progressive data firm Catalist, we appended a measure of each respondent’s community, allowing us to classify each respondent as living in an Urban, Suburban, or Rural area. Here, we explore the differences between respondents along those dimensions.
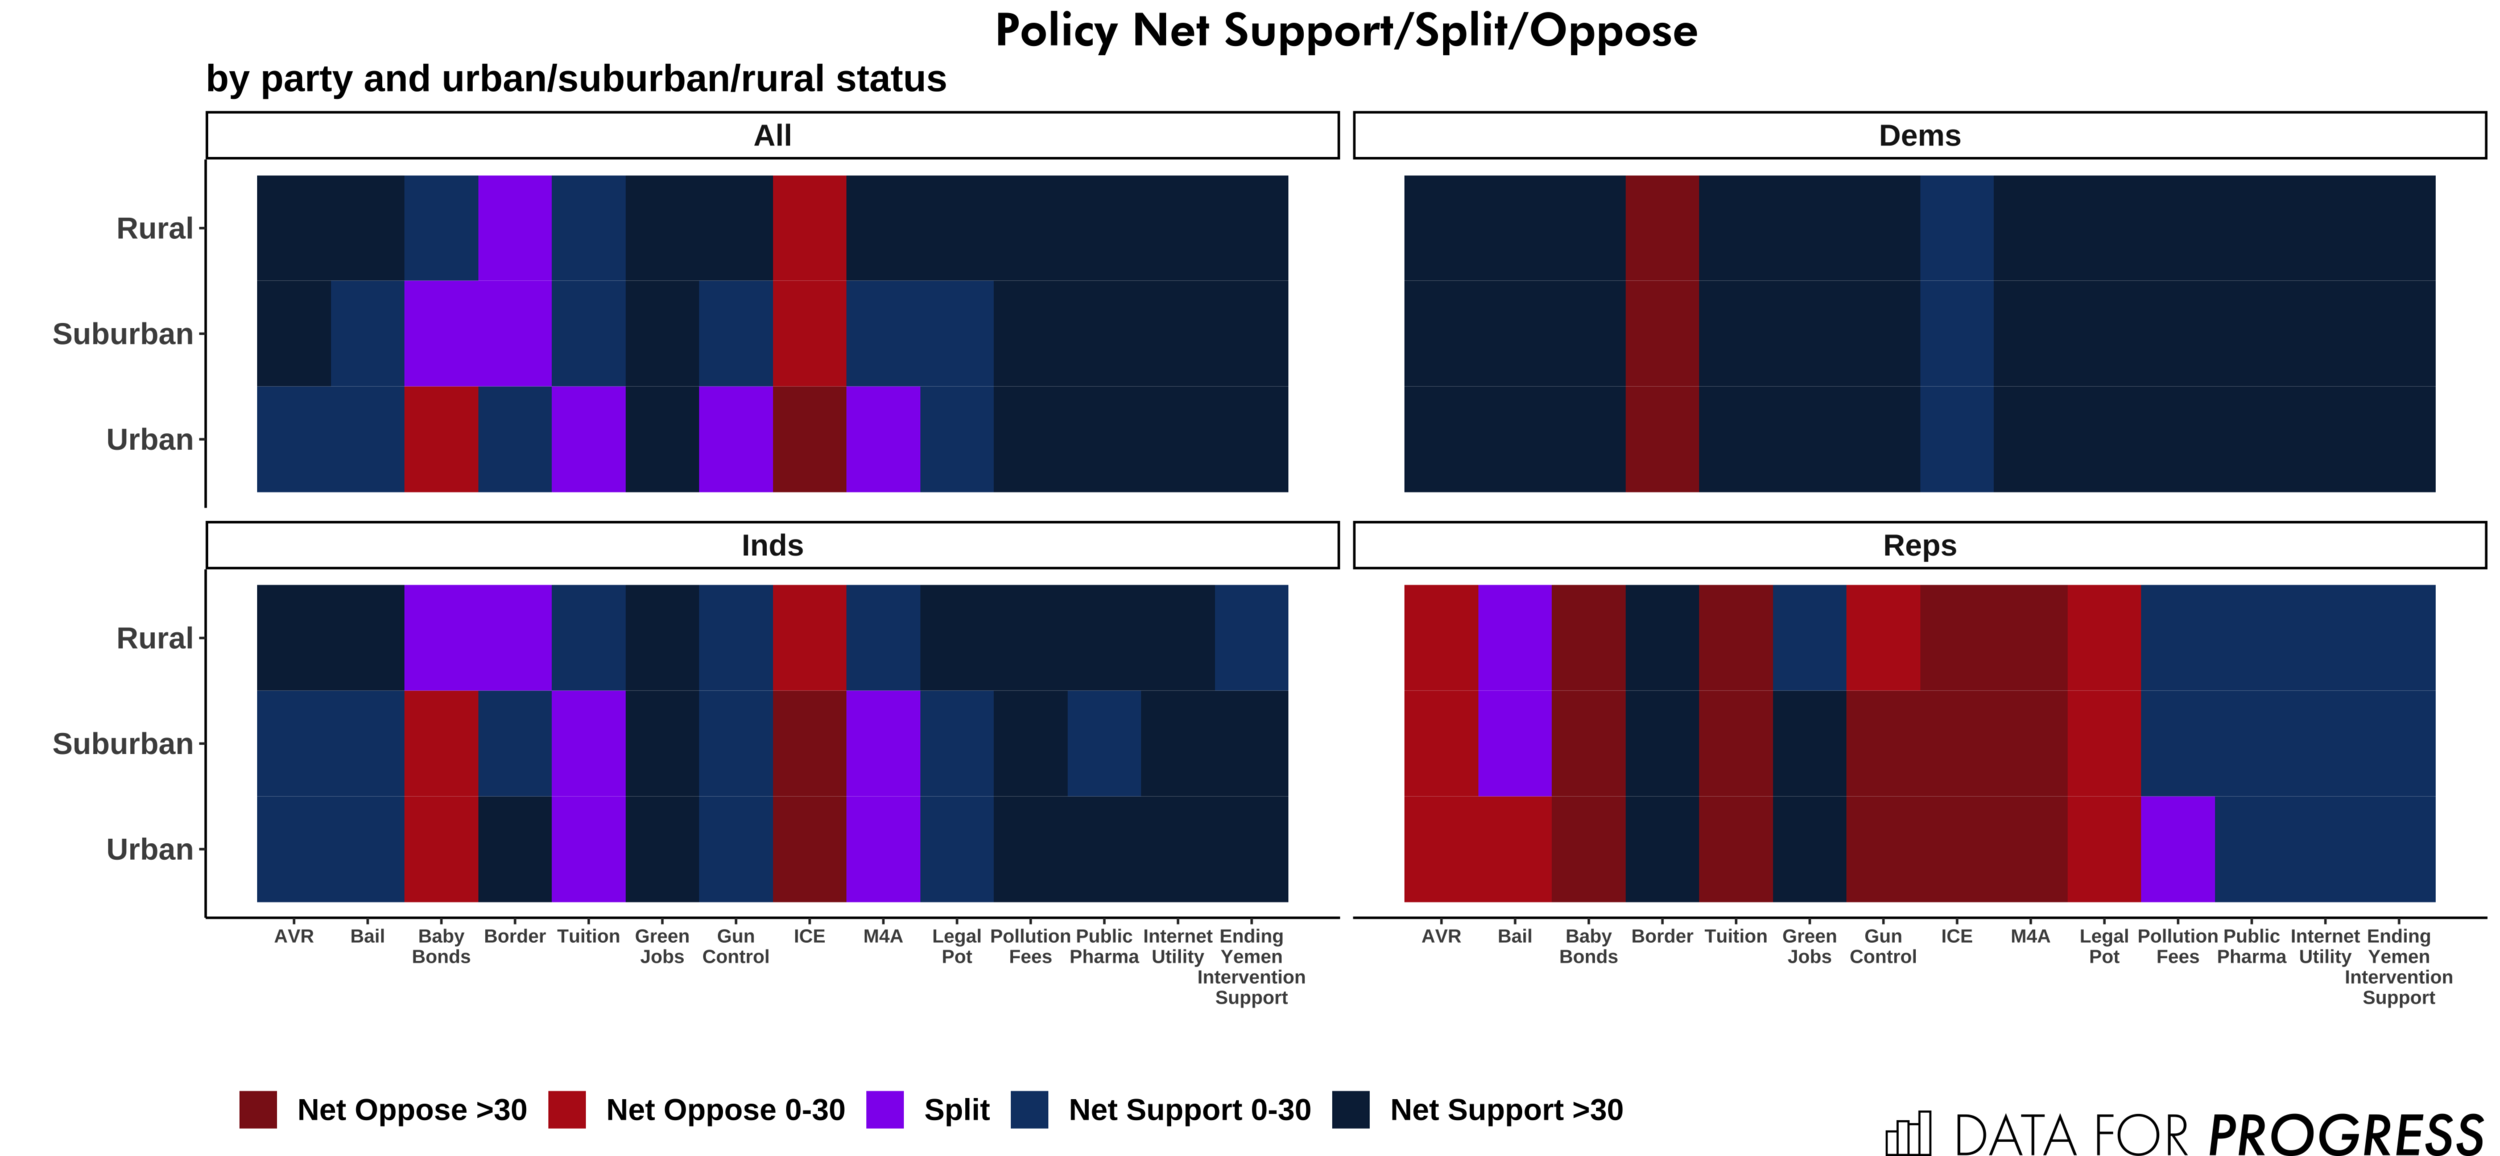
Democrats’ base of support is generally concentrated in suburban and urban areas, but there are some places where rural Democrats are among the most progressive, including on the Green New Deal. Urban-area Independents align with Democrats on many progressive issues, including opposition to further fortifying the border.
Where the Parties’ Supporters Are
While there has been some speculation about the role of rural voters in the Democratic Party’s future, we found that the party’s voters are still concentrated in suburban and urban areas. Overall, about 29 percent of Democrats were rural, 36 percent suburban, and 35 percent urban compared to about 46 percent of Republicans being rural, 34 percent being suburban, and 19 percent urban.

Demographics - Who are the rural, suburban, and urban Democrats, Republicans, and others?
In 2018, Democratic House candidates won 8 percent of urban Republicans, 4 percent of rural Republicans that they won and 6 percent of suburban Republicans. Democrats also performed well among Independent/other party voters, picking up 61 percent of urban Independents, 52 percent of those in the suburbs, and 46 percent of those in rural areas. Across the full sample, a statistically distinguishable majority of Independents broke for Democrats in 2018.

Race and ethnicity
Across Democrats and Independents in our sample, urban areas were the most diverse, and rural areas, the least. Across Republicans, urban, suburban, and rural areas were similarly lacking in diversity, although fully 11 percent of urban-area Republicans are Latino, significantly higher than suburban- or rural-area Republicans.


It is worth noting the demographic disconnect between voters and the full population in urban, suburban, and rural areas. While between one-fifth and one-quarter of the rural respondents in our sample were non-white or of mixed race involving some white ancestry, which is actually slightly higher the general population of non-whites in rural areas according to some other work. Voters in our survey were over two-thirds white, which is 10-15 percent higher than the general US adult population due to long-standing and generally expected differences between the two populations. While the composition of voters in urban areas is closer to that of the general population, any party seeking broader participation has a long way to go in terms of minority outreach.
Born-again status
While less than a quarter of Democrats across urban/suburban/rural status identified as born-again, a majority of rural Republicans and a clear plurality of suburban Republicans identified as born-again. While Democrats and Independent/third-party respondents were similar in their levels of self-reported born-again status, Republican respondents were outliers beyond every other subgroup and the full sample in their rates of self-reported born-again status.
The role of religiosity is sometimes underappreciated in modern American politics, while some scholars correctly emphasize the enduring power of the so-called religious right. Much more than the general population or the population of voters, the Republican Party is inhabited by born-again voters.

Education
On the other hand, Republican voters in our sample were outliers in the other direction on the subject of education. While Republicans living in urban areas were significantly more educated than Republicans living in rural areas, across the urban/rural/suburban divide, Republicans had as a proportion fewer college degrees than Democrats, Independents, and the sample overall. Most notably, rural Democrats had more college degrees than urban, suburban, or rural-area Republicans. Across other subgroups, the urban/suburban/rural divide was not a significant divider of education: rural, suburban, and urban Democrats and Independent/other party supporters overlapped one another in their proportions with college degrees.

Fear of Impending Demographic Change
As we outline in an earlier post, we asked respondents in our survey to consider the consequences of impending future demographic change. The scale is assembled from several items concerning the effect that immigration and racial/ethnic diversity in general might have on America’s culture and economy in the future. We built the scale first by presenting survey respondents with an illustration of America’s demographic future based on Census analyses on the subject. We prefaced the battery by telling respondents:
“As you may know, Census projections show that by 2043 African Americans, Latinos, Asians, and other mixed racial and ethnic groups will together be a majority of the population. Thinking about the likely impact of this coming demographic change, how much do you agree or disagree with each of these statements?”
That illustration was followed by these statements, with which respondents could strongly agree, somewhat agree, neither agree nor disagree, somewhat disagree, or strongly disagree:
Americans will learn more from one another and be enriched by exposure to many different cultures.
There will be too many demands on government services.
There will not be enough jobs for everybody.
We then assembled the Fear of Demographic Change scale from these items. Respondents who strongly agreed with the first statement were given the “least fearful” score for that item while those who strongly disagreed with the first statement were given the “most fearful” score for that item. Respondents who “strongly agreed” with the second and third statements were given those items’ “most fearful” scores, while respondents who “strongly disagreed” with statements two and three were given the “least fearful” scores. Intermediate answers fell in between on that scale.
Across the urban/suburban/rural divide, respondents were more divided by party than by urban/suburban/rural status. Democrats overall scored lower on the Fear of Demographic Change scale than Republicans by an amount outside the margin of error, and rural and suburban Democrats were below the overall sample proportion in those geographies.

Perhaps surprisingly, Democratic and Republican respondents living in urban areas were slightly higher on this scale than their counterparts in rural areas, albeit by quantities within the margin of error on both counts. Urban-area Republicans scored highest on the scale, while suburban and rural Democrats scored lowest.
Hostile Sexism Scale
In addition to asking respondents about their fear of likely future demographic change, we asked respondents in our survey a series of items meant to capture the concept of hostile sexism, discussed in more depth here. We assembled the scale in a similar fashion to the other scales reported here. The intuition is that, the higher respondents’ score on the scale, the higher they are in hostile sexism.
Here, the urban/suburban/rural divide produced a number of interesting differences. Perhaps contrary to some assumptions, Republicans living in urban areas are significantly higher in hostile sexism than Republicans living in rural areas, while Democrats and Independent/other party supporters are not significantly different across urban/rural/suburban status.
Indeed, across the full sample, respondents from urban areas are significantly lower on the hostile sexism than respondents in suburban areas, who themselves are significantly lower in hostile sexism than respondents in rural areas. Only Republican respondents scored significantly higher on this measure in urban areas than in rural areas.

Political Populism
Among the attitude scales we posed to our respondents we included a series of items designed to measure their affinity for Populism, a political belief which holds that “the people” should but do not currently control the political system, which instead is controlled by political elites. This belief system entails a skepticism of top-down political management, and of the corrupting power of money in politics. To measure this political affinity in our respondents, we asked them whether they strongly agreed, somewhat agreed, neither agreed nor disagreed, somewhat disagreed, or strongly disagreed with each of the following:
It doesn't really matter who you vote for because the rich control both political parties.
The system is stacked against people like me.
I'd rather put my trust in the wisdom of ordinary people than in the opinions of experts and intellectuals.
For each of these items, we gave the “strongly agree” respondents the highest score for Populism on each item, a 4 on a 0-4 range, while those who “strongly disagreed” with each item. The scale, therefore, is a percent value of the sum which might fall in the range of 0-12.
Contrary to many assumptions about the role of Populism in American politics, we do not find that it is merely a phenomenon among rural conservatives. On the contrary, populism was relatively stable across urban/suburban/rural status. Rural Independent/other party supporters were significantly higher on Populism than were rural Democrats or Republicans, while rural Democrats and Republicans were matched on Populism. Suburban Democrats were the lowest on Populism, significantly more so than rural or urban Democrats. Across the full sample, urban and rural respondents were higher on Populism than were suburban respondents.

Populism is equally popular among urban and rural Democrats, but slightly less popular among suburban Democrats. Rural Independents and urban Republicans are slightly more amenable to populism than their counterparts as well.
Racial Animus
As we explored in a previous post, measuring the concept of racial animus was an important part of this project. Eliciting racial animus in survey respondents is not a straightforward exercise, but to do so, we adapted scales commonly used in the academic study of racism into a single scale called the Racial Animus scale.
We asked respondents, “indicate the extent to which you agree with each of the following statements.” The items, presented below, were asked in random order.
Generations of slavery and discrimination have created conditions that make it difficult for African Americans to work their way out of the lower class.
I am angry that racism exists.
Irish, Italian, Jewish, and many other minorities overcame prejudice and worked their way up. Blacks should do the same without any special favors.
Racial problems in the U.S. are rare, isolated situations.
White people in the U.S. have certain advantages because of the color of their skin.
For each statement, responses included “strongly agree,” “somewhat agree,” “neither agreed nor disagree,” “somewhat disagreed,” or “strongly disagree.”
For the items pertaining to “Slavery,” “Angry that racism exists” and “White advantages,” the “strongly disagree” position is the position associated with higher levels of racial animus, while the “strongly agree” position is associated with lower levels of racial animus. For the “Other minorities” and “Rare problems” items, the “strongly agree” position is the position associated with higher levels of racial animus. To create our scale, the “highest racial animus” position was given a score of 4, down to a 0 for the “lowest racial animus” position. For example, respondents who strongly agreed that “Blacks should do the same without any special favors” on the “Other minorities” item were given a 4, those who somewhat agreed a 3, those who neither agreed or disagreed a 2, those who somewhat disagreed a 1, and those who strongly disagreed a zero. The Racial Animus scale is a sum of these values for each item.
In line with some previous work on this subject, racial animus was significantly higher in rural areas than in urban areas across the full sample. Democrats scored similarly low in measures of racial animus across the scale, while Republican and Independent/other party supporters gradually moved lower on the scale as they moved from rural, to suburban, to urban categories.
While rural-area Republicans were slightly higher than suburban- or urban-area Republicans on racial animus (47 percent vs. 43 percent and 44 percent, respectively), the party overall is significantly higher than Democrats, Independents, and the overall sample on this measure. However, because Independent/other respondents were each about halfway between Democrats and Republicans in racial animus, our data poses a vital question: In which direction do those “moderate” in racial animus move, when pulled by both sides?

Policies
Automatic Voter Registration
Across the urban/suburban/rural divide, the full sample was in net favor of nationwide automatic voter registration. Republicans on net were opposed to automatic voter registration, but Independents clearly broke in favor of the policy by an amount above the margin of error. Republicans across the urban/suburban/rural divide oppose automatic voter registration, with the intra-party differences not being outside the margin of error.
Perhaps intriguingly, Independents clearly split along the urban/suburban/rural dimension on this issue. While Independent/others in each type of geography supported Federal AVR overall, support was markedly higher in urban areas (+66 percent) than in suburban (+55) and rural (+55) areas. Compared to the full sample, Democrats, and Independents, Republican opposition to Federal AVR was a negative outlier.

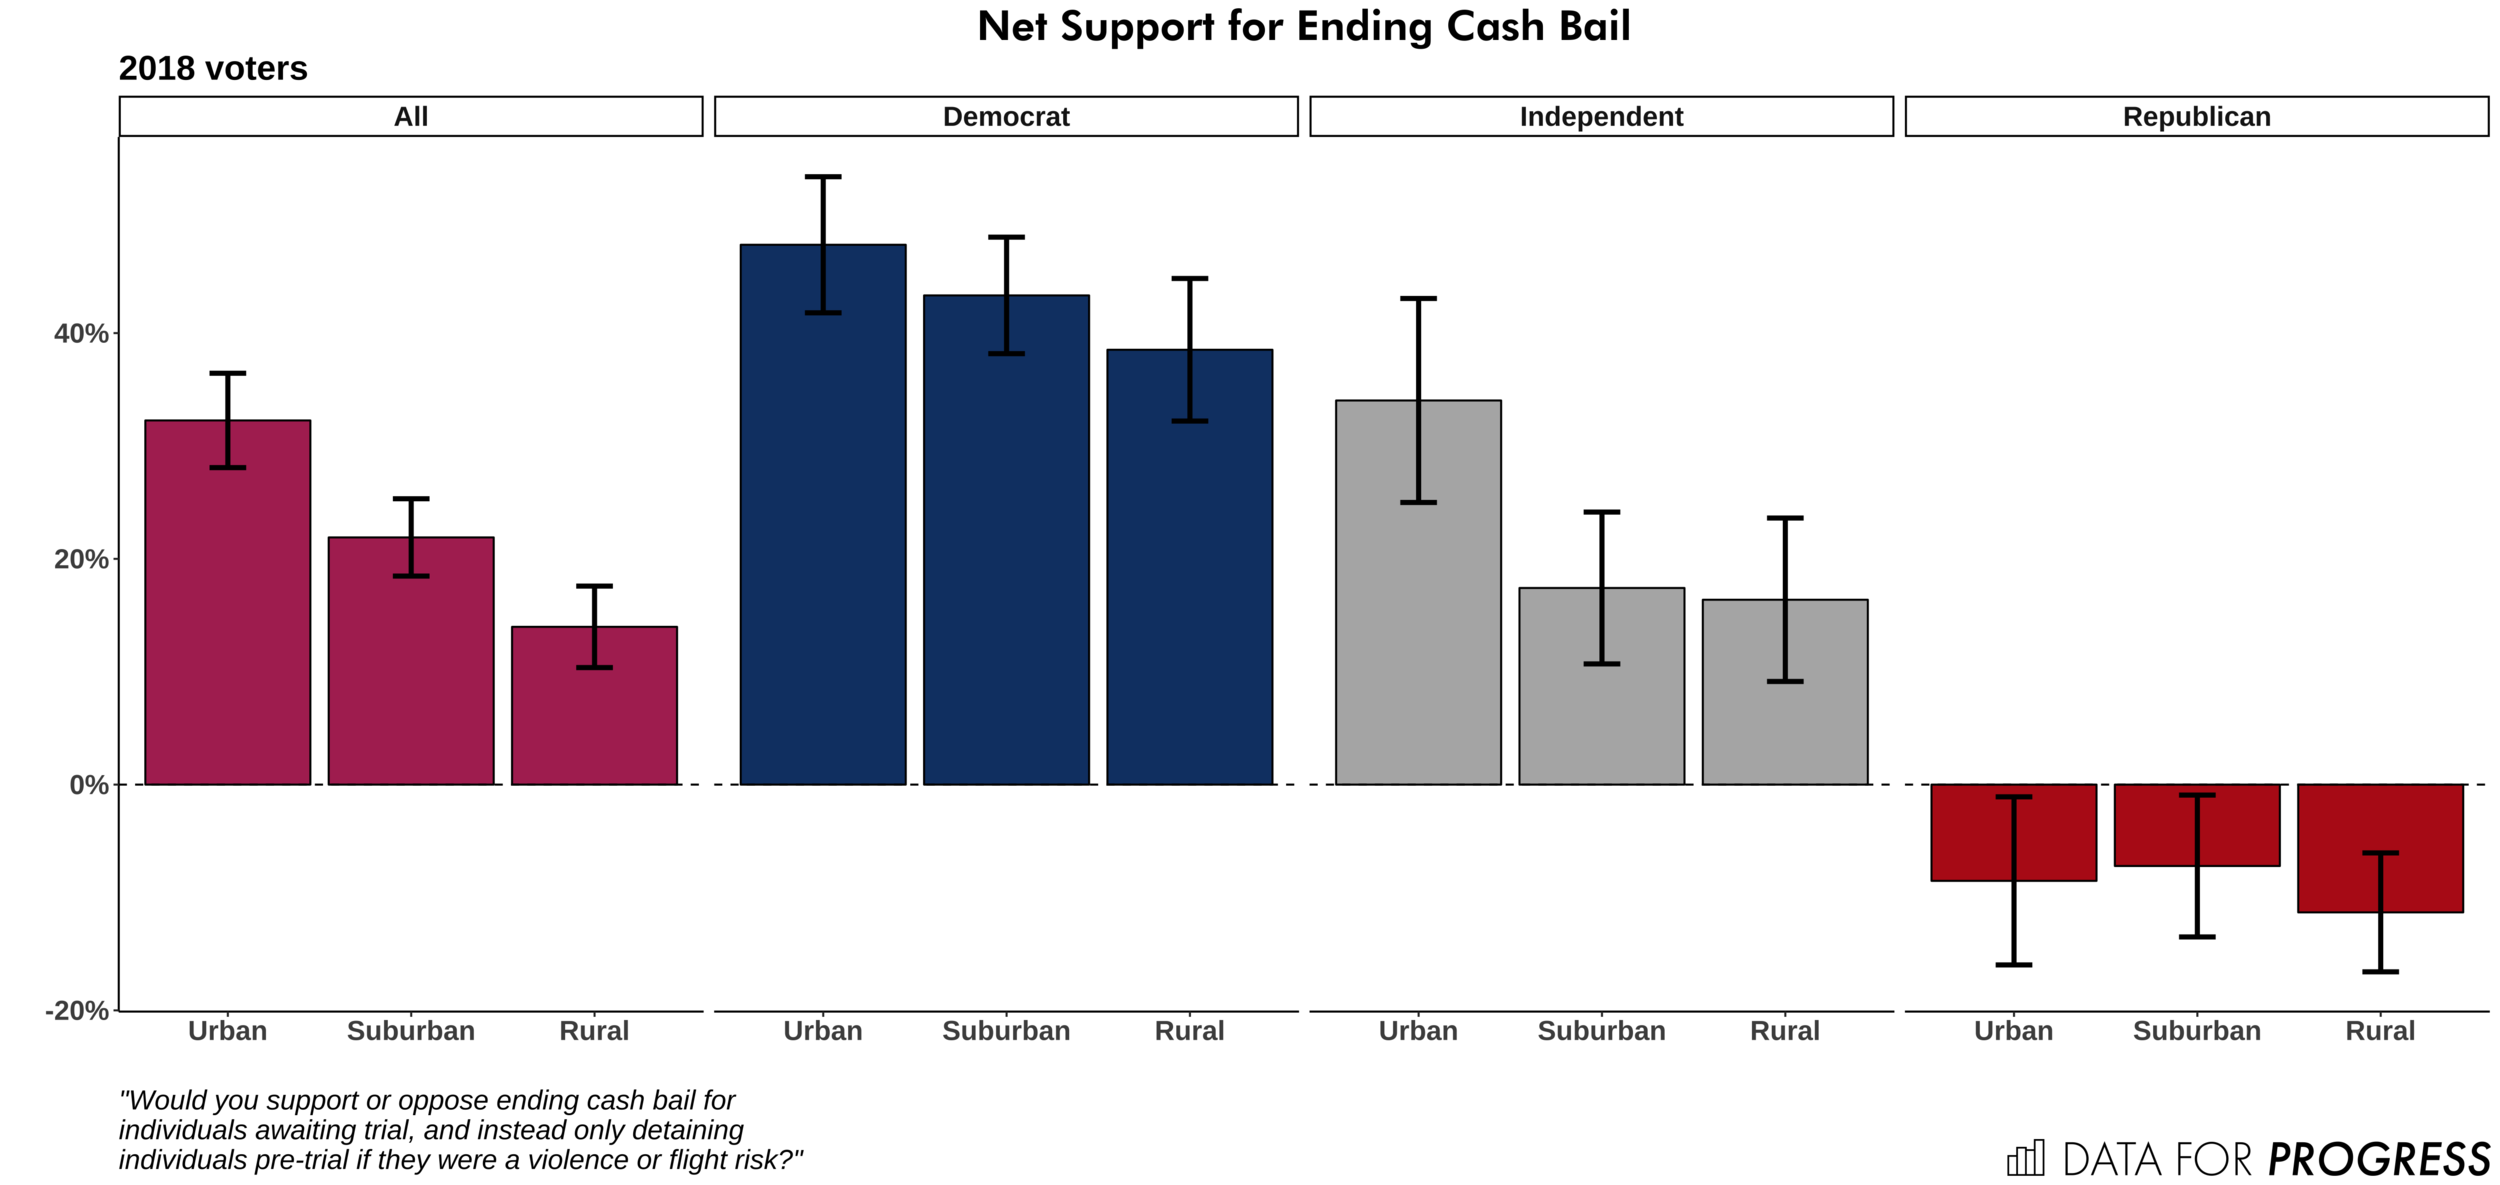
Ending Cash Bail
Perhaps surprisingly, voters across urban, suburban, and rural areas on net support ending cash bail except for those likely to be violent or flight risks. Democrats were strongly in favor of the position, with urban Democrats significantly more likely to support ending cash bail than rural Democrats. Urban Independent/other party supporters were also significantly more likely to report supporting an end to cash bail than their rural counterparts.
$5,000 Baby Bond
We asked respondents to consider their level of support for a $5,000 baby bond supplied by the Federal government. We included in the text of the item the idea that these bonds would be paid for by raising estate taxes on the wealthy. While we found that respondents overall were on net slightly opposed to the policy, there is significant geographic variation in this belief.
Urban-area Independent/other party supporters were significantly more supportive of the policy, being split overall (-1 percent on net) compared to suburban (-24 percent on net) and rural (-28 percent on net) Independent/other voters. Driven by the small upticks in support from Republicans and Democrats as respondents move from rural to urban, and the substantive upticks from Independents, urban respondents overall support baby bonds while suburban and rural respondents overall oppose baby bonds.
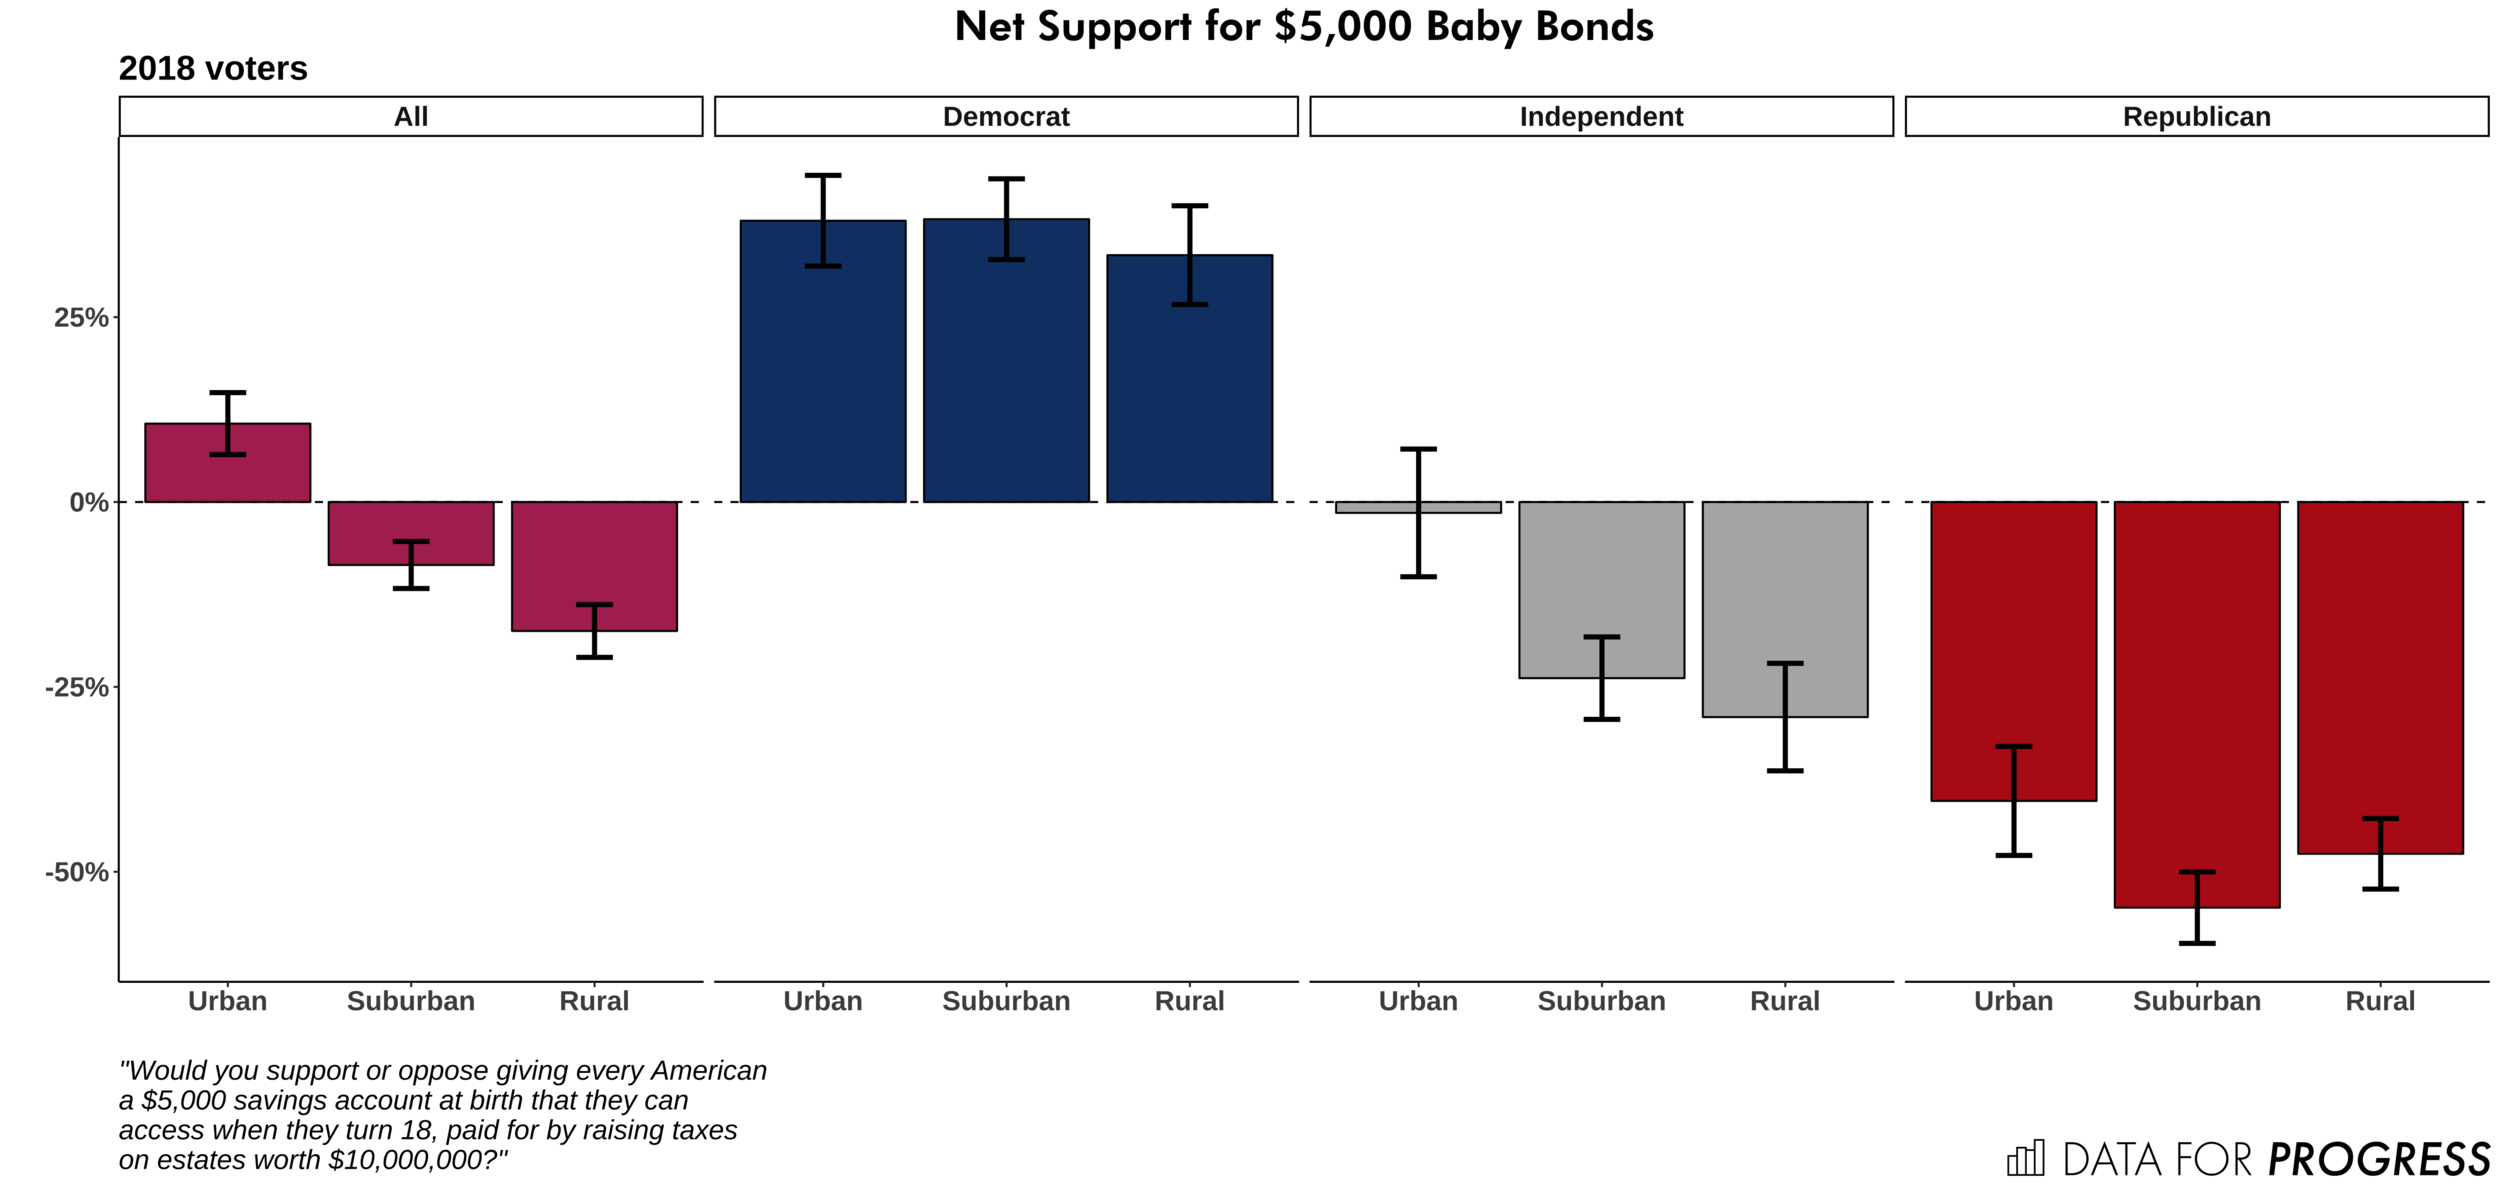
Support for the baby bond is concentrated among urban-area voters, and is not popular among Independents in suburban or rural areas. Voters in urban areas are the strongest overall supporters of the policy, which does not enjoy support across the urban/suburban/rural divide.
Increasing Border Security
We asked respondents about one of the most politicized issues of our time: the US-Mexico border, at which Trump has alternately promised a wall paid for by Mexico, a wall paid for by tariffs against China, a wall paid for by American taxpayers, drones paid for by American taxpayers, a permanent military presence paid for by our general military readiness, a border occupied by the Nazi gangs at the core of his base, and other combinations of words that occur to him on any given day. Like Trump’s capacity to remember his position on this issue at any given time, support for increasing border security in our sample was, at best, mixed.
Democrats and Republicans moved to their respective partisan corners on the issue of increasing security along the US-Mexico border. Curiously, urban-area Democrats were significantly less opposed to increasing border security (-48 percent) than their suburban (-53 percent) and rural counterparts (-59 percent), though the difference is more statistical than substantive.
Most importantly, Independents are narrowly in favor overall of increasing border security, though urban-area Independents are statistically split on the idea. As border security is both a highly salient feature of Trump’s policy agenda and an issue over which nominal non-partisans are split, Democrats will have to tread carefully and examine in more depth the nature of how to position appropriately on border security in the future.

Federal Tuition Assistance
As with other policy items asked of our sample that have already existed in political discussion for awhile, full Federal tuition assistance predictably drove respondents to their respective partisan positions. Democrats across the geographic divide support full Federal tuition assistance, and Republicans across the geographic divide oppose it. Independents were evenly split in rural areas (-3 percent on net) and suburban areas (-1 percent on net), but were clearly in favor of full Federal tuition assistance in urban areas (+17 percent on net).

A Green New Deal
We also asked respondents about a key feature of most Green New Deal proposals, a green jobs guarantee. Specifically, we asked respondents whether they supported “giving every unemployed American who wants one a job building energy-efficient infrastructure.” Across the political spectrum, we found support for a green jobs guarantee.
Our survey, having fielded from the end of October through election day on November 6, 2018, preceded the rollout of the Green New Deal. At that time, we found broad public support across party and geography for a green jobs guarantee. Support among Republicans was significantly higher in rural areas (+33) and suburbs (+35) compared to rural areas (+19). Support among Independent/other voters was significantly higher in rural (+59) and urban (+60) than in suburban areas (+42).
There remains a live debate in political science about what motivates Americans to support or oppose jobs programs, and we caution that the Green New Deal is a relatively fresh political idea not yet exposed to partisan vicissitudes in the way that policies like Medicare-for-All have been. But at present, a green jobs program appears to be a political winner among Democrats, among rural and suburban Republicans in particular, and among rural and urban Independents in particular.

Gun Control
While there is disagreement over the underlying mechanism, it is commonly thought that gun ownership is an important component of rural identity in a way that it is not for other American political identities. Our results here concur with that line of thought. While Democrats were uniformly in favor of gun control (+83, +83, and +87 for urban, suburban, and rural respondents), each other party ID group became more supportive of making some or all types of guns harder to buy as those groups moved from rural, to suburban, to urban geographies.
As Republicans moved from rural to urban status, their opposition to gun control decreases by twenty points (from a net -41 to a net -21). As Independents move from rural to urban, their net support for gun control increases by 12 points (from +13 to +25). As on some other policy issues discussed here, Republican voters across geographic subsets are outliers on net opposed to making some or all types of guns harder to buy.

Abolish ICE
As we reported in a previous post covering the policy items in our survey, there is not broad public support for abolishing ICE. However, across geographic subsets, there was a significant division within Republicans and Independent/other respondents. Urban-area Republicans were opposed to abolishing ICE (-66 percent) but less so than rural-area Republicans (-76 percent), with a similar gulf for urban Independents (-22 percent) versus rural-area Independents (-42 percent). Across the full sample, respondents were opposed to abolishing ICE in urban, rural, and suburban areas.

Medicare for All
As discussed in a previous post, Medicare for All as a policy has been in the general conversation long enough to be thoroughly politicized along partisan lines. Here, we find a geographic component to these splits. For example, Republicans living in urban areas are significantly more likely to support the policy (-41 percent on net) compared to suburban (-55 percent) and rural (-48 percent) Republicans. Intriguingly, Independent/other respondents living in rural areas were split (+2 percent on net) as were those in suburban areas (-3 percent on net), compared to clear support among urban Independents (+24 percent on net).

Marijuana Legalization
On the issue of marijuana legalization at the Federal level, we found a clear urban vs. rural divide among Republican and Independent/other respondents. We asked respondents to consider whether they supported or opposed Federal legislation to legalize marijuana. Across the full sample, respondents reported supporting the policy. Independent/other party supporting respondents living in urban areas were significantly more likely to do so than their suburban or rural counterparts. While Independent/other respondents on net supported marijuana legalization, the policy was significantly higher in support among urban Independent/others.
At the same time, Republicans living in suburban and urban areas were very nearly split (-11 percent net for both, compared to -30 percent for Republicans living in rural areas). On net, Republicans are on the wrong side of this issue compared to Independent/other respondents.

Pollution fees
We asked respondents whether they supported or opposed levying pollution fees on businesses associated with large amounts of greenhouse gas emissions. Pollution fees are often included as part of the Green New Deal, which is a set of policy proposals designed to revolutionize American infrastructure, its energy grid, and its high-tech manufacturing sectors. Across the political and urban/suburban/rural divide, we found net support for pollution fees. We caution that our survey was fielded in the weeks before the November 2018 election, before the Green New Deal had entered the broader conversation and, thus, before it was highly politicized.
While Republicans were equally narrowly supportive of pollution fees across the urban/suburban/rural divide, Independent/other party supporting respondents living in urban areas were significantly more likely than Independent/others living in rural areas. Across the full sample, overall, respondents in urban areas were more likely to support pollution fees than rural areas.

Public Generic Pharmaceuticals
We asked respondents if they supported a policy under which the government would provide generic pharmaceuticals, “even if it required revoking patents held by pharmaceutical companies.” Even with this wording, we found net positive support across the political spectrum for nationalized generic pharmaceuticals.
Perhaps intriguingly, rural Democrats supported this policy by a significantly higher margin than their urban counterparts (+70 percent vs. +60 percent). It is possible that the ongoing opioid crisis in rural America, or perhaps pharmaceutical industry concentration in urban areas contribute to these disparity, but more work is needed on a larger sample to investigate this disparity in more detail.

Support for a Public Internet Utility
Respondents across party ID and urban/suburban/rural status reported supporting the creation of a public Internet utility “to fill coverage gaps in rural, urban, or remote areas that currently lack robust Internet access.” Among Democrats and Republicans, respondents in rural areas were most strongly in favor of the proposition. Among Democrats, net support for a public Internet utility is significantly higher in rural areas (+77) than in urban areas (+67), though of course both margins are quite high.

Ending Support for Saudi Arabia’s Intervention in Yemen
Perhaps curiously, Republicans in rural areas and Independents in rural and suburban areas were significantly more supportive of ending support for Saudi Arabia’s intervention in Yemen than their urban counterparts. Democrats were uniformly supportive of ending intervention support.
As we have previously shown on this subject, even before Americans learned of the Trump’s overtly corrupt view of the US-Saudi relationship, Americans on net are ready to end assistance for Saudi Arabia’s intervention in Yemen. On this issue, rural and suburban Republicans were particularly out of step with the rest of the electorate: The share of rural and suburban Republicans who support ending intervention assistance was below the margin of error for the same quantities among Democrats, Independents, and voters overall.

Conclusion
Across the urban/suburban/rural divide, Democratic voters express clear support for the progressive agenda, and are against Trump’s “plan” to fortify the US-Mexico border. Rural-area Independents generally expressed somewhat more skepticism of the progressive agenda than suburban- or urban-area Independents, but were overall in favor of many of the proposals.. An array of progressive policy ideas, including the Green New Deal and other novel government programs, were popular among Independents.
John Ray (@johnlray) is a Senior Political Analyst at YouGov Blue.
Sean McElwee (@SeanMcElwee) is a co-founder of Data for Progress.
Methodology:
As part of our What The Hell Happened Project, Data for Progress commissioned a survey of 3,215 voters from YouGov Blue that was fielded October 27th through November 7th, which was weighted to be nationally representative of 2018 voters. The survey margin of error was +/-2 percent.
However, the total number of respondents analyzed here excludes those who could not be assigned to an urban/rural/suburban status. Our measure of urban/suburban/rural is derived from a Catalist model score for which some of our respondents did not have a value. Here, specifically, we look at the responses of 339 rural, 435 suburban, and 410 urban Democrats; 422 rural, 317 suburban and 186 urban Republicans; and 326 rural, 313 suburban, and 196 urban Independent respondents.