The Six Apparent Political Clusters
By Kevin Reuning (@KevinReuning)
In the lead up to the election one of the few non-election points of noise to breakthrough was a recent study by More In Common trying to identify the supposedly “hidden tribes” in American politics. This study received coverage across multiple national news outlets while unsurprisingly confirming the outlook of More In Common that there is a vast politically moderate middle. I was interested in what a similar type of analysis would reveal about voters using the issue questions that were asked in the Data for Progress What The Hell Happened survey. What I find, using a somewhat similar method, is different from the Hidden Tribes report: There are groups that hold clear polarized opinions and while there might be a moderate group they are numerically small. I want this to be taken with a grain of salt though as I hope that by discussing about how the analysis is done I can also illuminate some of the problems in class analysis.
The Supposed Tribalism of American Politics
Before stepping into the analysis it is useful to discuss language. One of the more common tropes in political punditry today is that the American electorate is driven by “tribalism.” Few of these pundits take the time to define what they mean by tribalism or political tribes. The concept of tribes has been criticized within anthropology for over half a century as being poorly specified and unhelpful (outside of the context where it is a legal designation). At best it means a group that can be defined by shared language, location and other commonalities. This does not define the political tribes that pundits so obsessively talk about today. Pundits then must be using the language of tribalism for another reason.
What instead do pundits mean when they slip to the language of tribes and tribalism? They are not relying on definitions but on the connotations and feelings that the idea of a tribe stirs in many Americans. The implication is that American political groups are somehow primitive and irrational, that the opinions they hold do not reflect any sort of real preference towards policies but instead reflect belonging in a group. There is political science research that does support this notion of group based politics, but the authors do not use the language of tribes and tribalism to describe it. The use of tribalism so common among the pundit class is reflective of the settler mindset intersecting with this idea of group based politics. In this post I develop classes, because it is reflective of the methodological models that I use. Although this language also comes with baggage it reflects well what we are actually trying to do: classify people into political groups that have more in common (politically) than they do with those outside of the group.
Creating Classes
Latent class analysis can be a powerful tool. It is used to identify clusters of similar observations by assuming there exist a set of classes (groups of observations) that respond similarly to questions and we just need to untangle them. With latent class analysis we can find the structure that is hidden in what appears to be random noise. But, we need to ensure that the structure that is created provides useful insight and is not an accident of assumptions or random noise. This requires proceeding with care and demonstrating the strength of results whenever possible. I proceed by using Naive Bayes where each respondent is modeled as belonging to a single class and each class is assumed to have an independent way of responding to each question. These responses are modeled as coming from a categorical distribution which does not assume any ordering on the responses and so I can include those who say they are Not Sure in the model.
The first step in estimating these models is to select data to use. I use fourteen issue questions included on the What The Hell Happened survey. I use issue questions only as I want to examine difference in political opinions and nothing else.
Next, I need to identify the optimal number of classes. One way to do this is to test how well the model fits the data given a different number of classes. Of course this can be problematic as additional classes should always lead to a model that better fits the data. To prevent this I withhold a portion of the responses from the model and then evaluate the model on those withheld responses. This leads to another problem: I can only evaluate using data when I have estimated the probability of a respondent being in a category and the pattern of responses for each category. This requires me to withhold a random portion of responses from each individual. In the end 10 percent of responses are withheld, the model is trained and then I check for how well the model fits the data.
I use two metrics to evaluate model fit. First I judge the portion of responses that are answered correctly. With only one class I can be right on held-out data approximately 25 percent of the time. By adding a second class this jumps to just under 35 percent and we see slow increases from there until it reaches approximately 39 percent at six classes. After that there is no substantial improvement by adding additional classes. The second metric I use is log-likelihood which shows a similar pattern. Given these findings I proceed with six classes. The question, of course, is whether 39 percent is a good accuracy rate. It is substantially larger than assuming only a single class exists but it is also substantially worse than being able to predict responses perfectly. The problem is that we know there is error in answering surveys and so even if we were able to perfectly place everyone in their true class and perfectly define how each class responded to the questions we would still expect to be below 100 percent accuracy, but we don’t know how far below we will be in that case. This is one of the problems in quantitative analysis: we do not know how accurate we theoretically should be.

The Six Classes
With the number of classes in hand I then re-estimate the model using all the data provided and begin the entirely arbitrary work of providing labels to categories. This is done by looking at the response patterns for each class and trying to decide how to read the tea leaves as to what type of person this represents.
No Opinion
Starting with my favorite group first, there appears to be a discernible set of people who were consistently “Neither.” Across all the questions they were very likely to respond to the range of questions that they were neither supportive nor opposed to the policy position. This was their predominant position on drug testing welfare beneficiaries, automatic voter registration, providing a pathway to citizenship for undocumented immigrants, and national marijuana legalization, among other issues. They even had no strong position on guns (not shown). A more charitable characterization of these groups would be that they are moderates, but that assumes that the middle position of “Neither” reflects a well informed idea that both political positions are wrong. In contrast, there is some evidence that those who pick middle category options are actually those who do not have an opinion and pick it because they want to save face. This is why I opt to call these No Opinion, as opposed to moderates. Even if they are true moderates, we will see later that they make up a small portion of the electorate.

Progressives
The next class is best labeled “Progressives.” Here, respondents are likely to be strong supporters of Medicare for All, a wealth tax, free college tuition, and green jobs while opposing drug testing medicare beneficiaries, a border fence and deporting undocumented immigrants. Perhaps surprisingly there is less clear consensus over marijuana reparations and a path to citizenship for some undocumented immigrants. In general though, the responses are not just in the direction we would expect but also tend to be at the extremes of either Strongly Support or Strongly Oppose.

Conservatives
On the other side are “Conservatives” who look a bit like a mirror image of the Progressives above. There is strong opposition to Medicare for All, automatic voter registration, a wealth tax and free tuition with support for drug testing welfare beneficiaries, deporting undocumented immigrants and building a fence. Perhaps surprisingly, there is no uniformity when it comes to green jobs or ending cash bail and there actually might be some tacit support among this class for a path to citizenship for some undocumented immigrants.
The fact that the “Progressive” class might marginally oppose a path to citizenship while “Conservatives” marginally support it could be a sign that the model is doing a poor job. Or it could be a result of this issue not being far enough for Progressives while being just enough for Conservatives. And of course it could be that our understanding of the issue positions of these two groups are wrong. This is not necessarily a problem with doing latent class/clustering analysis, but does reflect the difficulty of interpreting the results. The classes that are created can only be labeled given our own understanding of the world.

Moderate Democrats
Now that the simple classes are gone we get to the more complicated ones to identify. The next class features more tepid support for progressive policies such as Medicare for All and green jobs, although there is strong support for a wealth tax. In addition there is some opposition to a border fence. There also does not seem to be clear preferences on drug testing welfare beneficiaries or on a path to citizenship for some undocumented immigrants. This class then seems to lean towards the left but not as uniformly and does not hold as extreme of views. This leads me to labeling them as “Moderate Democrats.” Moderate Democrats are pushing towards progress, but they are not entirely certain about it.

Reactionary
The second to last group is perhaps even stranger. They seem to only agree on three issues: they want to drug test welfare beneficiaries, deport undocumented immigrants and increase border security. There might be some tepid support for economic progressive positions such as a wealth tax and green jobs, but no support for Medicare for All. The best I can do to label this group is to identify them as “Reactionaries,” the Steve Bannon populists perhaps.

Low Information
The final class is really only distinguishable by their increased chance of saying they are Not Sure. In most of the previous classes the Not Sure option was near 0 for each question whereas in this class it breaks above 25 percent across many of the questions. The only two issues that there may be a clear opinion on are drug testing welfare recipients (supportive) and wealth tax (also supportive).

Separate Classes
One last way to examine how well the model identifies groups is by looking at individuals chances of being in each class. What we would hope for is that each individual would have a high probability of being in only a single class. To examine this I looked at the probability of an individual being in the class they are most likely to be in compared along with the probability of them being in their second most likely class. The plots below shows this.
Each plot includes just those most likely to be in that class with their probability of being in that class and their probability of being in the bottom class. What we see is that in a lot of cases the probabilities are high, which is good. It also identifies though the overlap which are also informative. It appears that both Conservatives and Moderate Democrats had a relatively high probability of being in the Reactionary class. In fact the Reactionary class seems to be the most likely class in a lot of cases.

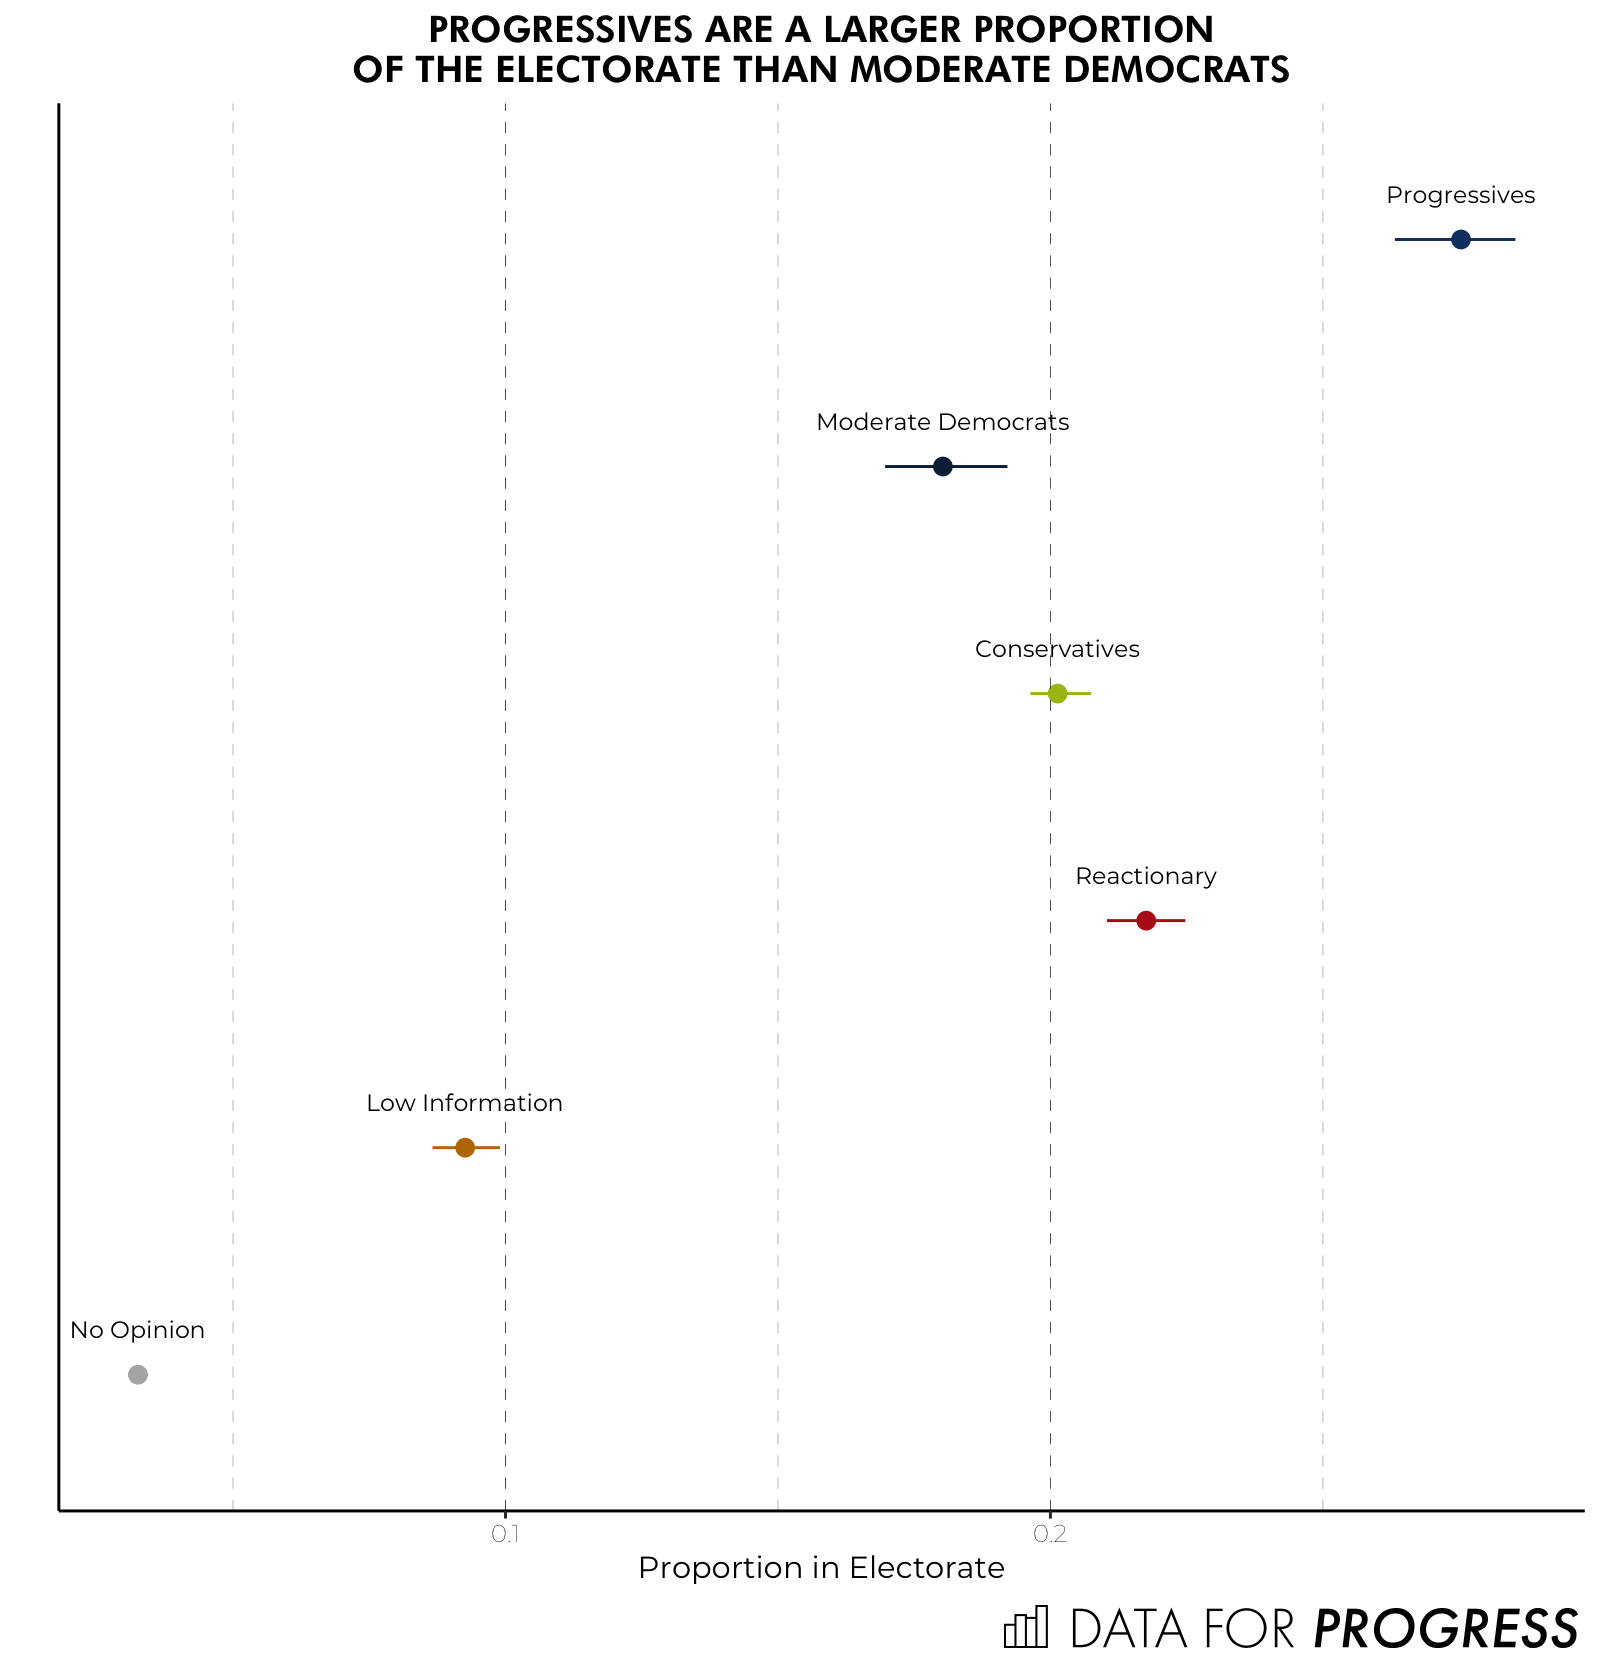
Proportion of the Electorate
Before wrapping it up we can look at how common each class is in the electorate. The four more informative classes are the most common with the Progressive class being the most common. Twenty-six to 28 percent of the electorate was categorized into this class while 21 percent to 22 percent was categorized as Reactionary. On the lower end the No Opinions (aka the possible moderates) made up only about 3 percent of the electorate and the Low Information class made up 9 percent to 10 percent of the electorate.
Conclusion
Latent class or clustering analysis is a powerful tool, but like all methodological tools it requires assumptions. These assumptions should be made as explicit as possible and the limitations of the classes should be addressed transparently. Here I have shown six classes within the responses to the What The Hell Happened survey. Two of these classes are likely uninteresting, they make up a small portion of the electorate and they do not have very coherent opinions. The other four illuminate the political divides we currently have. There are those out there with a more progressive mindset, those with a conservative mindset, and so on.
Kevin Reuning (@KevinReuning) is an assistant professor of political science at Miami University. His research can be found here.
As part of our What The Hell Happened Project, Data for Progress commissioned a survey of 3,215 voters from YouGov Blue that was fielded October 27th through November 7th, which was weighted to be nationally representative of 2018 voters. The sample was weighted using estimates of the electorate from Catalist, a voter file firm with a lengthy track record of success. We’ve shared this dataset with leading academics and practitioners and will be publishing the results of their analysis as well as our own.