

Switchers: Who changed their vote in 2018?
By John Ray, Alissa Stollwerk and Sean McElwee
After 2016, media outlets feverishly raided donut shops and diners in the Midwest to explain the phenomenon of the Obama-Trump voter, missing possibly the revolt against the GOP in suburban districts that would in 2018 cost Republicans the House. Here, we use a unique survey dataset to explore the attitudes of these swing vote switchers in 2018. These voters were responsible for surprises like Trump winning states Democrats had considered a Blue Wall, which then all gave Democrats large victories again in 2018.
Some of the differences between how these voters behaved in 2016 and in 2018 will be accounted for by turnout, but some can be explained by voters moving between the two parties. Who are these voters, and what can help us understand their vote choices?
To analyze these groups, we broke down voters into several types:
Those who voted for President Obama in 2012, Hillary Clinton in 2016, and their House Democratic candidate in 2018 (“Dem-Dem-Dem voters,” or “loyal Democrats”)
Those who voted for Mitt Romney in 2012, Hillary Clinton in 2016, and a Democratic candidate in 2018 (“Rep-Dem-Dem”)
Those who voted for President Obama in 2012, Trump in 2016, and a Democratic candidate in 2018 (“Dem-Rep-Dem”)
Those who voted for Romney in 2012, Trump in 2016, and a Democratic candidate in 2018 (“Rep-Rep-Dem”)
Those who voted for President Obama in 2012, Trump in 2016, and a Republican candidate in 2018 (“Dem-Rep-Rep”)
Those who voted for Mitt Romney in 2012, Trump in 2016, and a Republican candidate in 2018 (“Rep-Rep-Rep,” or “loyal Republicans”)
These combinations do not cover every possible set of vote choice behavior between 2012, 2016, and 2018. For example, a voter may have chosen Mitt Romney in 2012, Hillary Clinton in 2016, and a House Republican candidate in 2018. As is generally true of a losing candidate, Romney likely did not attract many Democrats who then swung back to their party in 2016, nor did Clinton attract many Republicans who then went home in 2018. Our sample bears this out: Including survey weights, just ten of the 3,215 respondents in this portion of the survey would identify as “Rep-Dem-Rep” voters. For 2012 and 2016 vote, we pulled respondent data from the YouGov panel.
An important feature of most of these groups, aside from the loyal Democrats and loyal Republicans, is that these groups are very small. Most voters are consistent partisans, and switchers are rare, something that is not surprising given the increased polarization that has dominated national politics for the past half-century. The survey includes 1,152 loyal Democrats, 1,017 loyal Republicans, 35 Rep-Dem-Dem voters, 30 Dem-Rep-Dem voters, 44 Rep-Rep-Dem voters, and 70 Dem-Rep-Rep voters.
We acknowledge that these are very small sample sizes. As we caution throughout, these results should only be viewed as exploratory. What we offer is a set of suggestive patterns about this electorate that should be useful for future research and for setting the stage for the conversations progressives and Democrats will need to have about their positioning in future elections.
In this post, we begin by offering some insights into how these different groups of voters look along certain demographic measures, and we provide a preliminary look at some of their self-reported political beliefs and policy preferences.
Demographic Characteristics
Because we are limiting our analysis to those with past vote history in recent elections, it isn’t surprising that they’re older than the average American. For each of the voting categories we study here the average age was between 52 and 55 except for loyal Republicans and Rep-Rep-Dem voters, whose average ages were each about 61. The following figure plots the share of each category voter by the share of that category under the age of fifty. Perhaps not surprisingly, more loyal Democrats were typically generally younger.

Perhaps also unsurprisingly, as voter categories move from left to right, they become gradually whiter. While loyal Democrats are closest to representing a cross-section of the population at being 68 percent white, 22 percent Black, 7 percent Latinx, and 3 percent other race, fully 92 percent of loyal Republican voters were white, 6 percent Latinx, and about 2 percent Black and other race.

Across the voter breakdowns in our sample, the relatively high variation in the smaller groups makes it difficult to draw a clear set of distinctions, but generally speaking, a slightly higher share of voters who broke for Democrats in 2018 had a college degree than did voters who chose Republican candidates in 2018. About 45 percent of loyal Democratic voters had a college degree or above, compared with about 31 percent of loyal Republican voters.

Additionally, we find that Romney-Trump voters who defected to the Democrats in 2018 typically came from the suburbs, while Obama-Trump voters who returned to the Democrats in 2018 were split between living in suburban and rural areas. A plurality of loyal Republicans in our sample lived in rural areas, while Democrats were split between living in urban and in suburban areas. Consistent with some other work on the 2018 electorate, we find that voters who shifted from President Obama to the Republicans in recent years lopsidedly live in rural areas.

Not surprisingly, self-identified political moderates formed pluralities among the vote switcher categories, and formed an outright majority of Romney voters who have since gone Democratic in 2016 and 2018. But fully 42 percent of Obama-Trump voters who returned to the Democratic Party in 2018 identified as conservative, compared with 33 percent who identified as liberal. Fully 54 percent of Romney-Trump voters who defected to a Democratic candidate in 2018 identified as conservative or very conservative.

Similarly, in terms of party identification, a majority of the Obama-Trump voters who voted for a Democratic candidate in 2018 identified as Democrats, compared with a Republican majority of Romney-Trump voters who broke Democratic in 2018. This result vexes some hot takes about the nature of the 2020 election landscape: In a Presidential year, partisans will come home to a greater degree than they typically will in a midterm election, meaning the electoral coalitions assembled by either party in 2018 are not necessarily reliable guideposts for the coalitions they’ll need in the future.

Racial Animus and Switchers
Trump has repeatedly embraced racist and xenophobic views in a way that is unusual in American politics, perhaps for its directness if not for its content itself. Given this, many have asked to what extent racial animus can explain the rise of Trump, as well as perhaps the backlash against him in 2018.
To answer this, we asked respondents several items corresponding to the notion of racial animus. Racial animus is a concept studied in the political science and political psychology literatures to measure racial attitudes in respondents without requiring them to explicitly state racial animus, which respondents are thought to be averse to doing (though some recent research calls this assertion into doubt).
Specifically, respondents were asked to “indicate the extent to which [they] agree with each of the following statements.” The items, presented below, were asked in random order.
Generations of slavery and discrimination have created conditions that make it difficult for African Americans to work their way out of the lower class.
I am angry that racism exists.
Irish, Italian, Jewish, and many other minorities overcame prejudice and worked their way up. Blacks should do the same without any special favors.
Racial problems in the U.S. are rare, isolated situations.
White people in the U.S. have certain advantages because of the color of their skin.
For each statement, respondents were asked whether they strongly agreed, somewhat agreed, neither agreed nor disagreed, somewhat disagreed, or strongly disagreed. For the “Slavery,” “Angry” and “White advantages” items, the “strongly disagree” position is the position associated with higher levels of racial animus, while the “strongly agree” position is associated with lower levels of racial animus. For the “Other minorities” and “Rare problems” items, the “strongly agree” position is the position associated with higher levels of racial animus. To create our scale, the “highest racial animus” position was given a score of 4, down to a 0 for the “lowest racial animus” position. For example, respondents who strongly agreed that “Blacks should do the same without any special favors” on the “Other minorities” item were given a 4, those who somewhat agreed a 3, those who neither agreed or disagreed a 2, those who somewhat disagreed a 1, and those who strongly disagreed a zero. The scale is a sum of these values for each item. For convenience of interpretation, we report the score as a percent below.
Because of the small sample sizes of the groups in between the straight Democrats and the straight Republicans, these results should be considered preliminary. There are not enough respondents in each bin, or too much variation across bins (or both) to say whether some of these cross-group differences are actual differences.
One thing we can conclude is that consistent Republican voters demonstrate much higher levels of racial animus than consistent Democratic voters. The difference between consistent Republican voters and Democratic voters (47 percent vs. 12 percent of the full racial animus scale) is greater than the difference between Millennial voters and non-Millennial voters (26 percent of the scale vs. 30 percent), between white and non-white voters (32 percent vs. 21 percent of the scale), and between the college educated and those without a college degree (32 percent vs. 25 percent).
Looking specifically at switchers, there is a clear, general trend consistent with existing hypotheses about the role of racial animus in voting for conservative candidates: Voters who have voted for more Republican candidates and moved toward Republican candidates have higher racial animus scores than those who have voted for Democratic candidates. It’s especially worth noting that Romney/Clinton/2018 Democrat voters have much lower racial animus scores than Obama/Trump/2018 Republican voters. Not all vote switchers are equal when it comes to racial animus, and they appear to be sorting based at least in part on the parties’ general views on race.
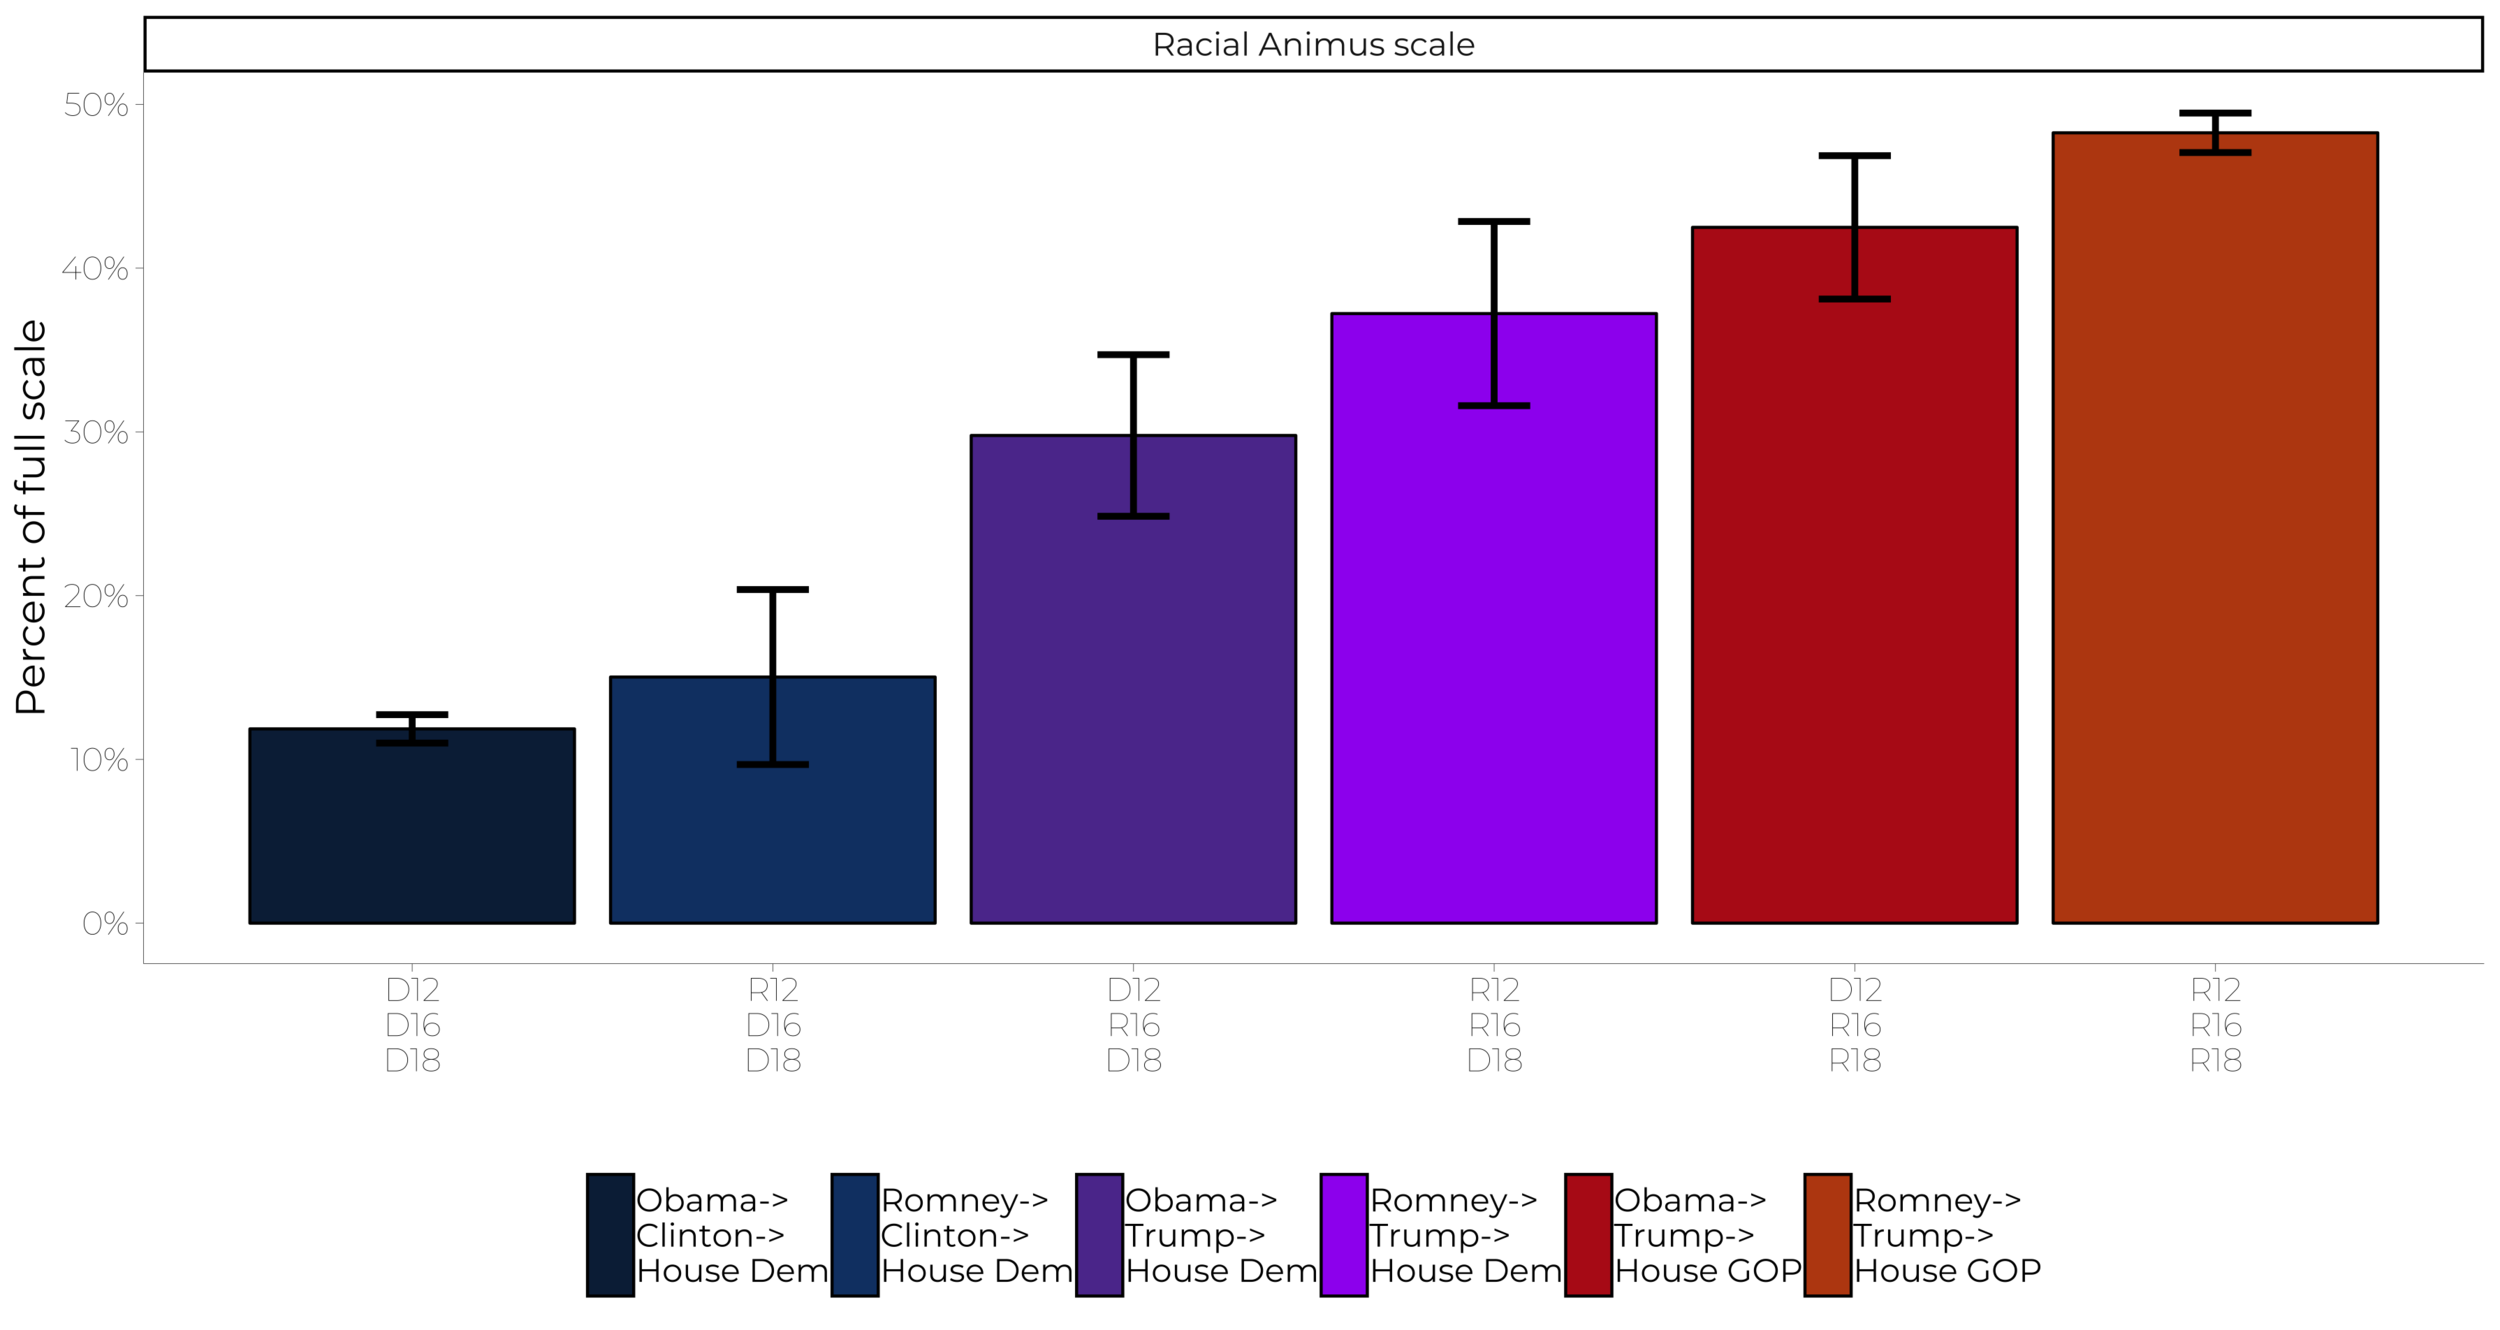
On the one hand, these results do not clearly break in favor of one party’s rhetoric or the other: The mean racial animus scores of Obama-Trump-Dem 2018 voters and of Romney-Trump-Dem 2018 switchers are both above the mean value of loyal Democrats, and below the mean value of loyal Republicans. But the attitudes of voters are different from the behavior of our politicians: Trump is getting marginally more extreme on race, while Democrats have not changed their position much since 2016. As Trump’s party becomes increasingly reliant on white nationalism for votes and dollars, Democrats should increasingly view the persuadable middle as an opportunity, not a challenge, on questions of race.
In many future elections, Democrats will need the votes of at least some reliable Republicans. The 2018 election cycle has shown that the current Republican obsession with racist appeals and white identity will not serve them well in the future. Between straight-Democratic and straight-Republican voters lies an array of party switchers who score lower on measures of racial animus than the GOP’s continued electoral fortunes require them to be.
Hostile Sexism
In addition to embracism racism and xenophobia, Trump’s hostility to women is a defining characteristic of his presidency. In 2016, analysts were forced to square their understanding of Trump’s sexism with his perhaps surprising levels of support from white women. To investigate this, our survey included a battery of items measuring hostile sexism, a common measure of anti-woman sentiment used in the social science literature on the subject. To measure hostile sexism, we included several items assessing respondents’ views toward women. Respondents were asked to indicate the extent to which they agreed or disagreed with the following statements: Respondents were asked to indicate the extent to which they agreed or disagreed with the following statements:
Most women interpret innocent remarks or acts as being sexist.
Women are too easily offended.
Most women fail to appreciate fully all that men do for them.
For each item, respondents could select whether they strongly agreed, somewhat agreed, neither agreed nor disagreed, somewhat disagreed, or strongly disagreed with each item. Similarly to the racial animus scale, we summed responses such that higher values represented higher levels of sexism. For each item here, a “strongly agree” was given a value of 4, “strongly disagree” a value of 0, with 3, 2, and 1 going to “somewhat agree,” “neither agree nor disagree,” and “somewhat disagree” respectively.
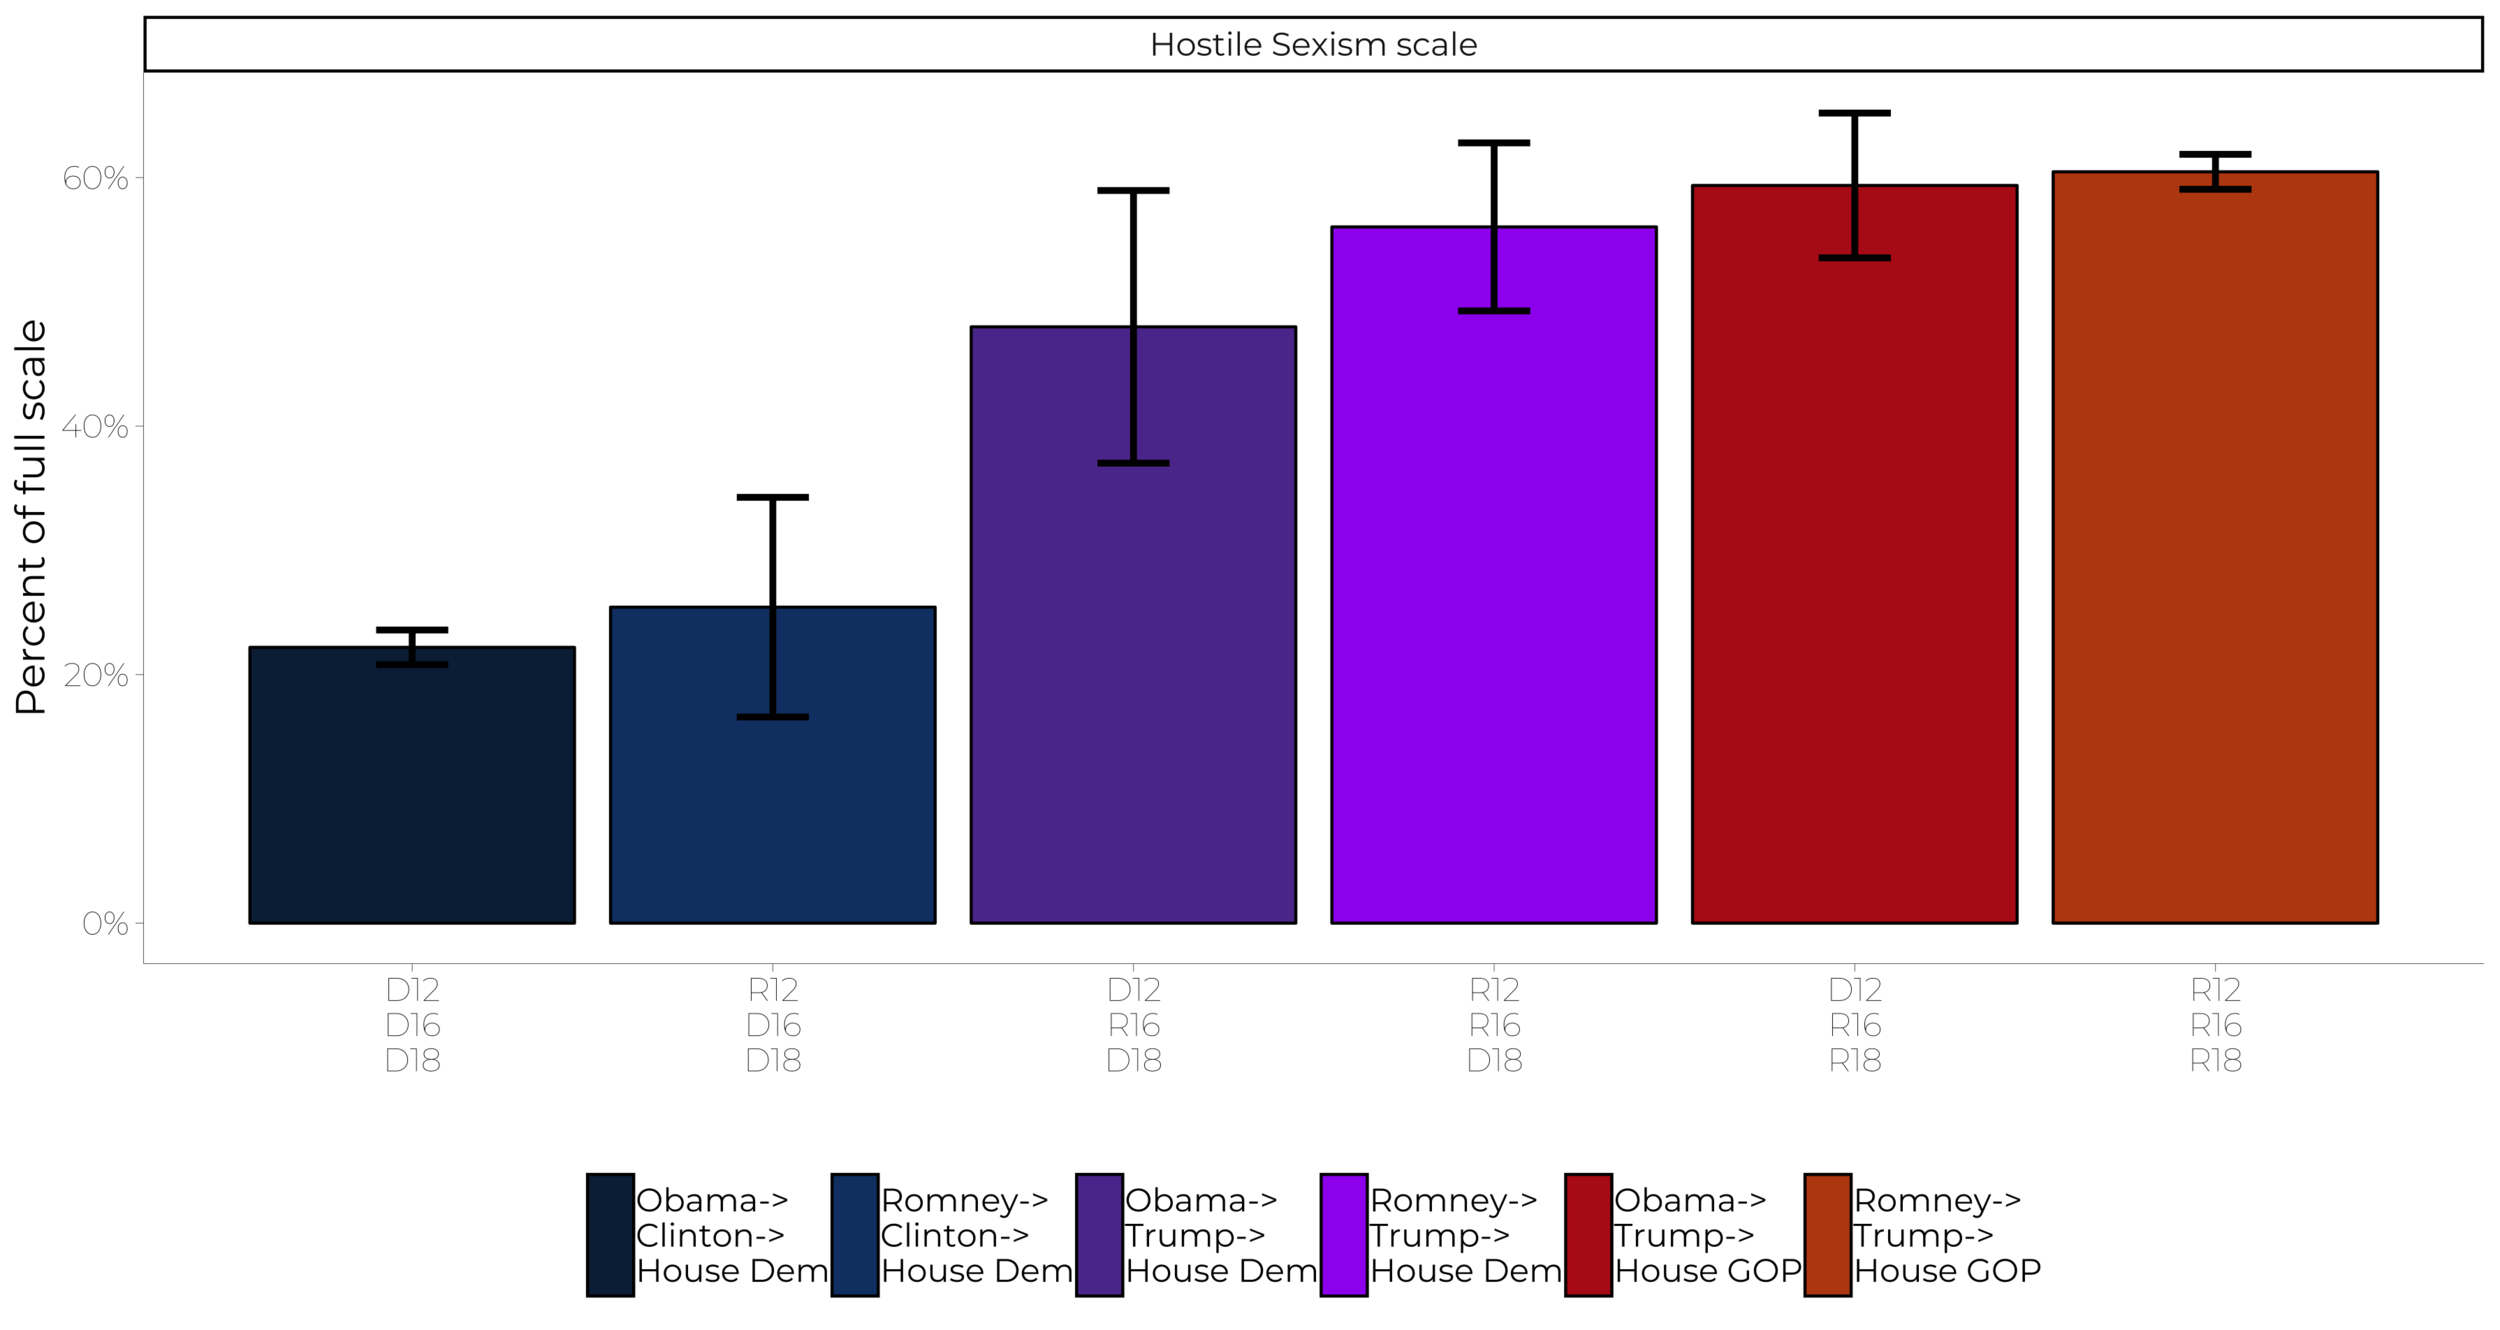
Loyal Democrats and Rep-Dem-Dem voters scored lowest on this measure of hostile sexism, with the average response gradually ticking up as voters get closer to being loyal Republicans. As with the racial animus scale, Obama-Trump-Dem 2018 and Romney-Trump-Dem 2018 voters fell into a middle ground above loyal Democrats and below loyal Republicans. This result paints a mixed picture for Democrats: Having picked up these voters in an election without an outright hostile sexist like Trump on the ballot, it is important to note for 2020 that, with the misogynist-in-chief returning to the ticket, Democrats will have to navigate an electorate comprised of a fair number of “moderates” on gender equality.
These particular measures paint a mixed portrait for Democrats: Vote switchers are not clearly on one side of history or the other on questions of race and gender equity. But as the Republican party is increasingly subsumed to Trump’s brand of hate, while Democrats pursue a more inclusive strategy, the gulf between vote switchers and Trump’s party is likely to grow.
Fear of Demographic Change
While both racial animus and hostile sexism clearly include elements of fear about the future -- a future which will surely include a more diverse and less white-male group of political leaders -- we also asked an explicit battery of items designed to tap into respondents’ fear of future demographic change. To do so, we began by presenting respondents with an illustration of America’s demographic future based on a composite of Census analyses on the subject. We began this battery by telling respondents:
“As you may know, Census projections show that by 2043 African Americans, Latinos, Asians, and other mixed racial and ethnic groups will together be a majority of the population. Thinking about the likely impact of this coming demographic change, how much do you agree or disagree with each of these statements?”
That illustration was followed by these statements, with which respondents could strongly agree, somewhat agree, neither agree nor disagree, somewhat disagree, or strongly disagree:
Americans will learn more from one another and be enriched by exposure to many different cultures.
There will be too many demands on government services.
There will not be enough jobs for everybody.
We then assembled the Fear of Demographic Change scale from these items. Respondents who strongly agreed with the first statement were given the “least fearful” score for that item while those who strongly disagreed with the first statement were given the “most fearful” score for that item. Respondents who “strongly agreed” with the second and third statements were given those items’ “most fearful” scores, while respondents who “strongly disagreed” with statements two and three were given the “least fearful” scores. Intermediate answers fell in between on that scale.

The distribution of responses to this scale by voting behavior is similar to the distribution on other scales. Vote switchers fell into a middle ground between loyal Democrats and Rep-Dem-Dem voters and loyal Republican voters. Here, the upper end of the confidence interval for Rep-Rep-Dem voters just within the lower bound of the margin of error for loyal Republicans (an upper guess of 60% along the Fear of Demographic Change scale for Romney-Trump-House Dem 2018 voters and a lower guess of 60% for loyal Republican voters). As respondents become more like loyal Republican voters, generally speaking, they express more fear over what future demographic change may bring for American culture and government services.
Populism
Finally, we asked respondents a series of items designed to measure their affinity for Populism, a political belief which holds that “the people” should but do not currently control the political system, which instead is controlled by political elites. This belief system entails a skepticism of top-down political management, and of the corrupting power of money in politics. To measure this political affinity in our respondents, we asked them whether they strongly agreed, somewhat agreed, neither agreed nor disagreed, somewhat disagreed, or strongly disagreed with each of the following:
It doesn't really matter who you vote for because the rich control both political parties.
The system is stacked against people like me.
I'd rather put my trust in the wisdom of ordinary people than in the opinions of experts and intellectuals.
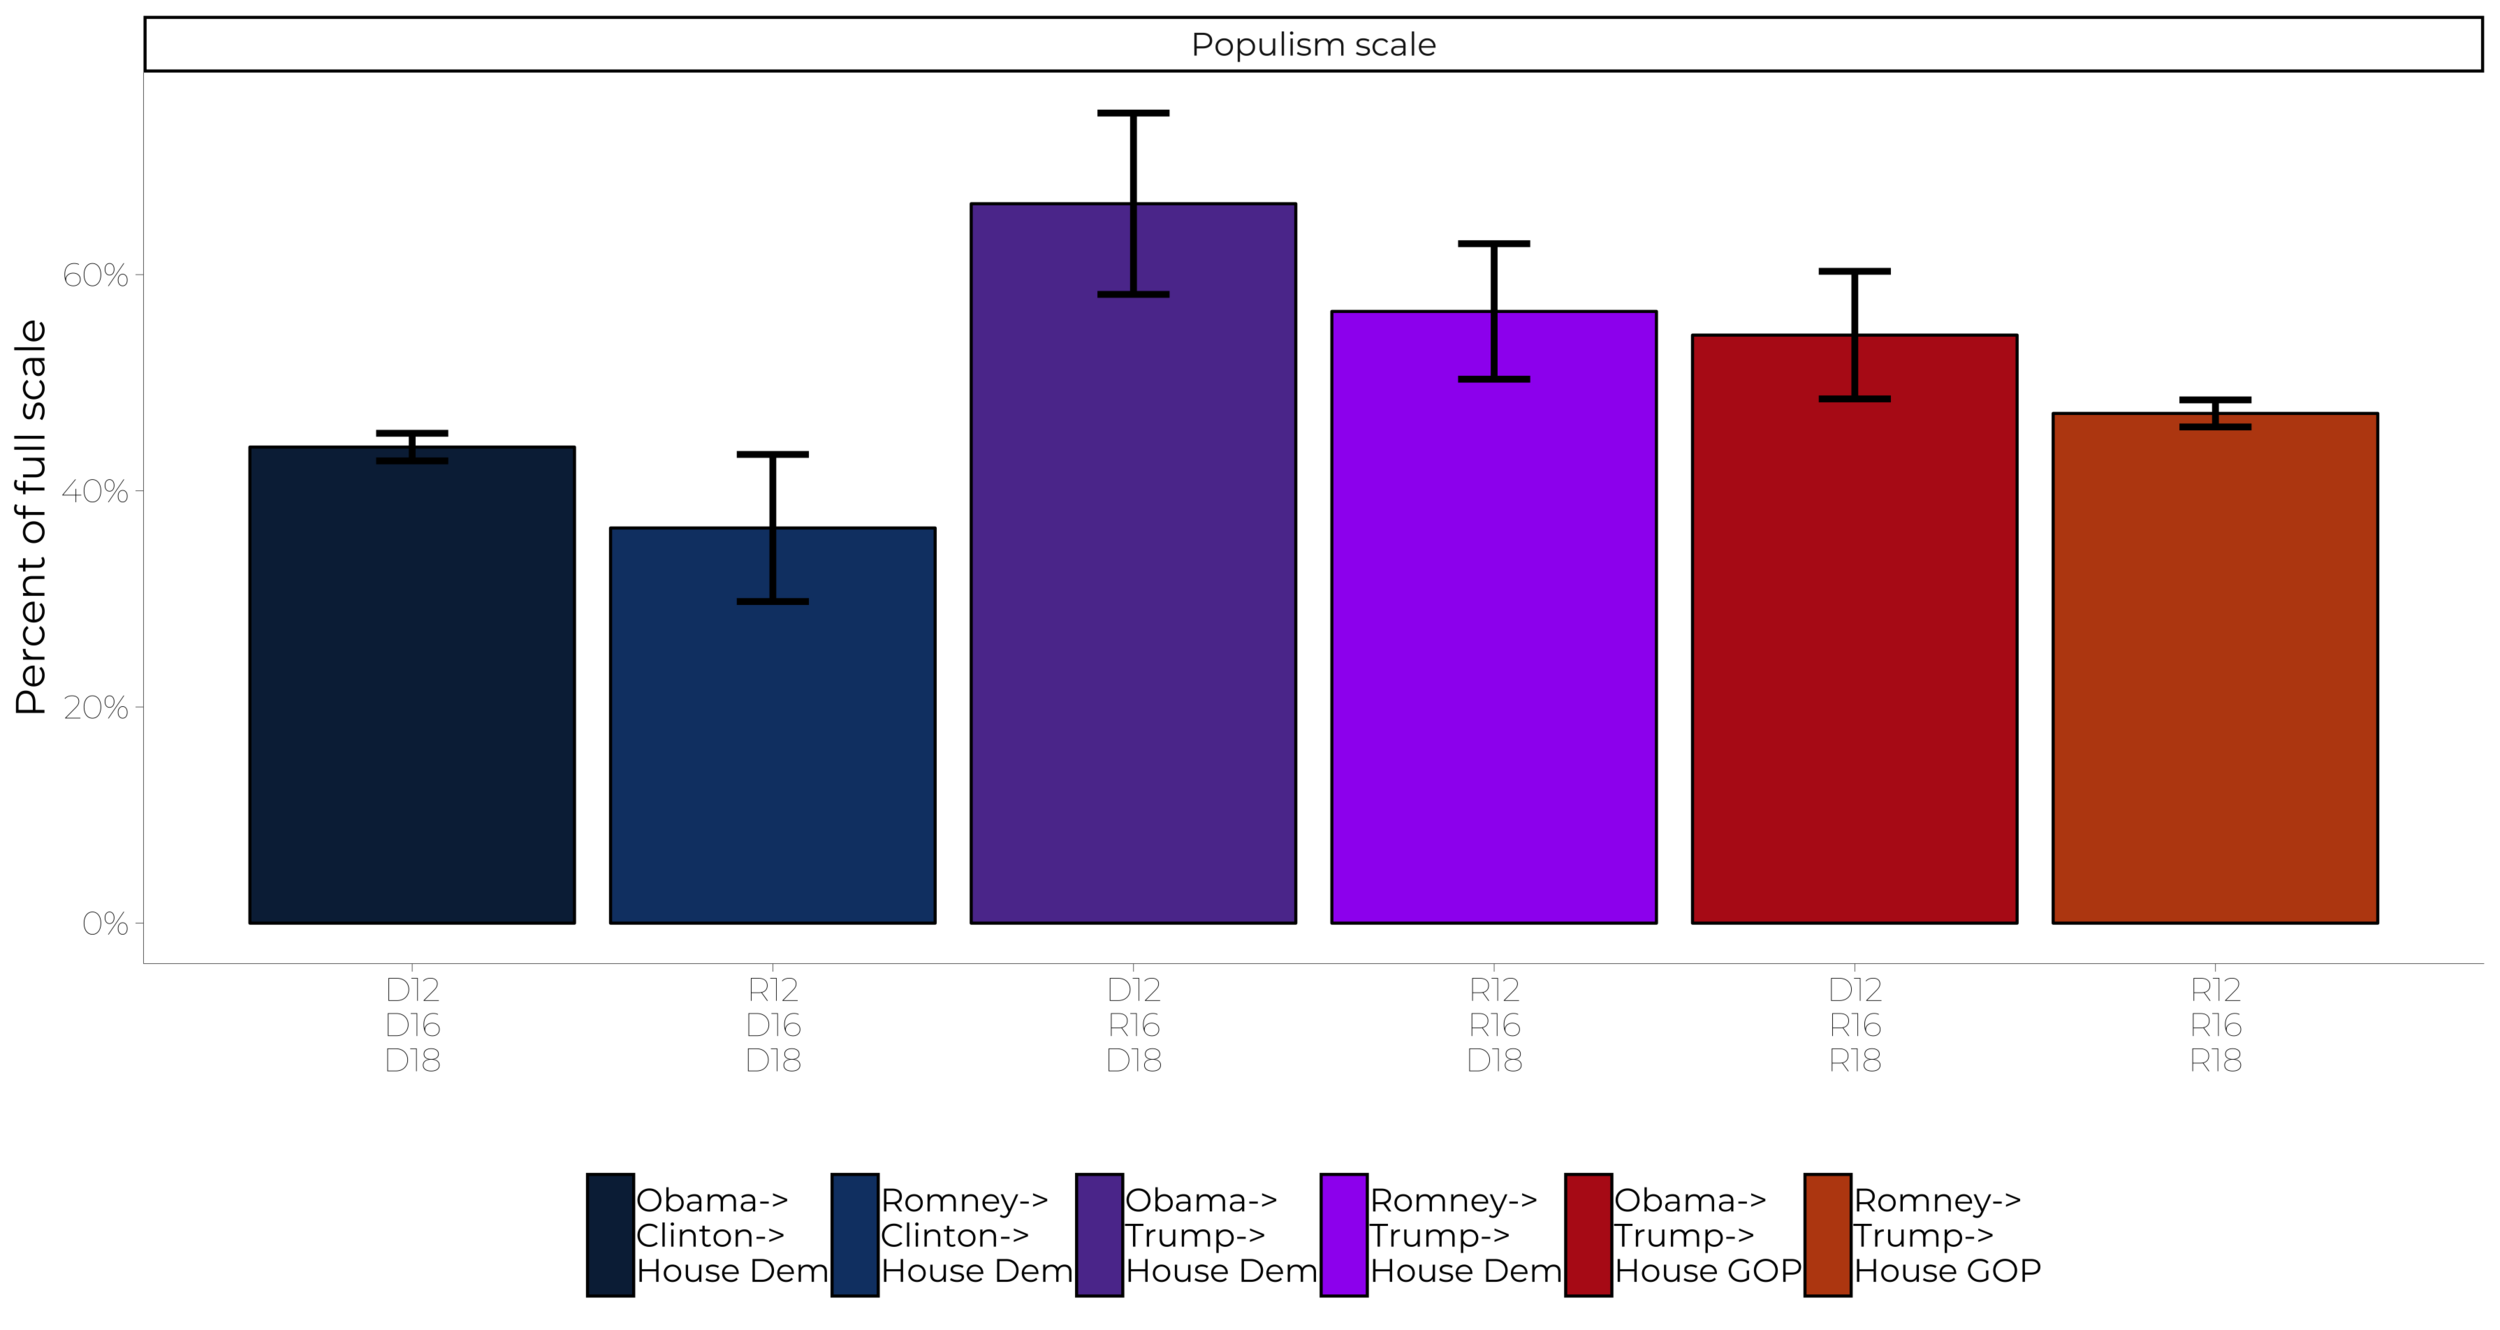
For each of these items, we gave the “strongly agree” respondents the highest score for Populism on each item, a 4 on a 0-4 range, while those who “strongly disagreed” with each item.
Here, unlike on the other attitude scales we looked, vote switchers were higher than both loyal Democrats and loyal Republicans. Those who swung from Obama-Trump back to the Democrats in 2018, and those who swung from Romney-Trump to the Democrats in 2018, were more Populist than loyal voters from either camp. There has been some speculation that the Populist aspects of Trump’s campaign rhetoric helped him with some voters in key states in 2016. There has also been some suspicion that the gulf between Trump’s rhetoric and his policies would cost him points among those same voters in 2018. These results are consistent with both ideas: One, Democrats who swung from Obama to Trump in 2016, and then back to the Democrats in 2018, scored highest on our measure of Populism. Two, voters who had backed both Romney and Trump and then swung to the Democrats were also high on our measure of Populism.
Policy Positions of Switchers
Next, we turn to some more specific policy questions posed of the respondents in our sample. Because of the small sample size (due to the small share of the electorate these voters make up) our findings should be considered preliminary, but we can still draw some early lessons.
Automatic Voter Registration
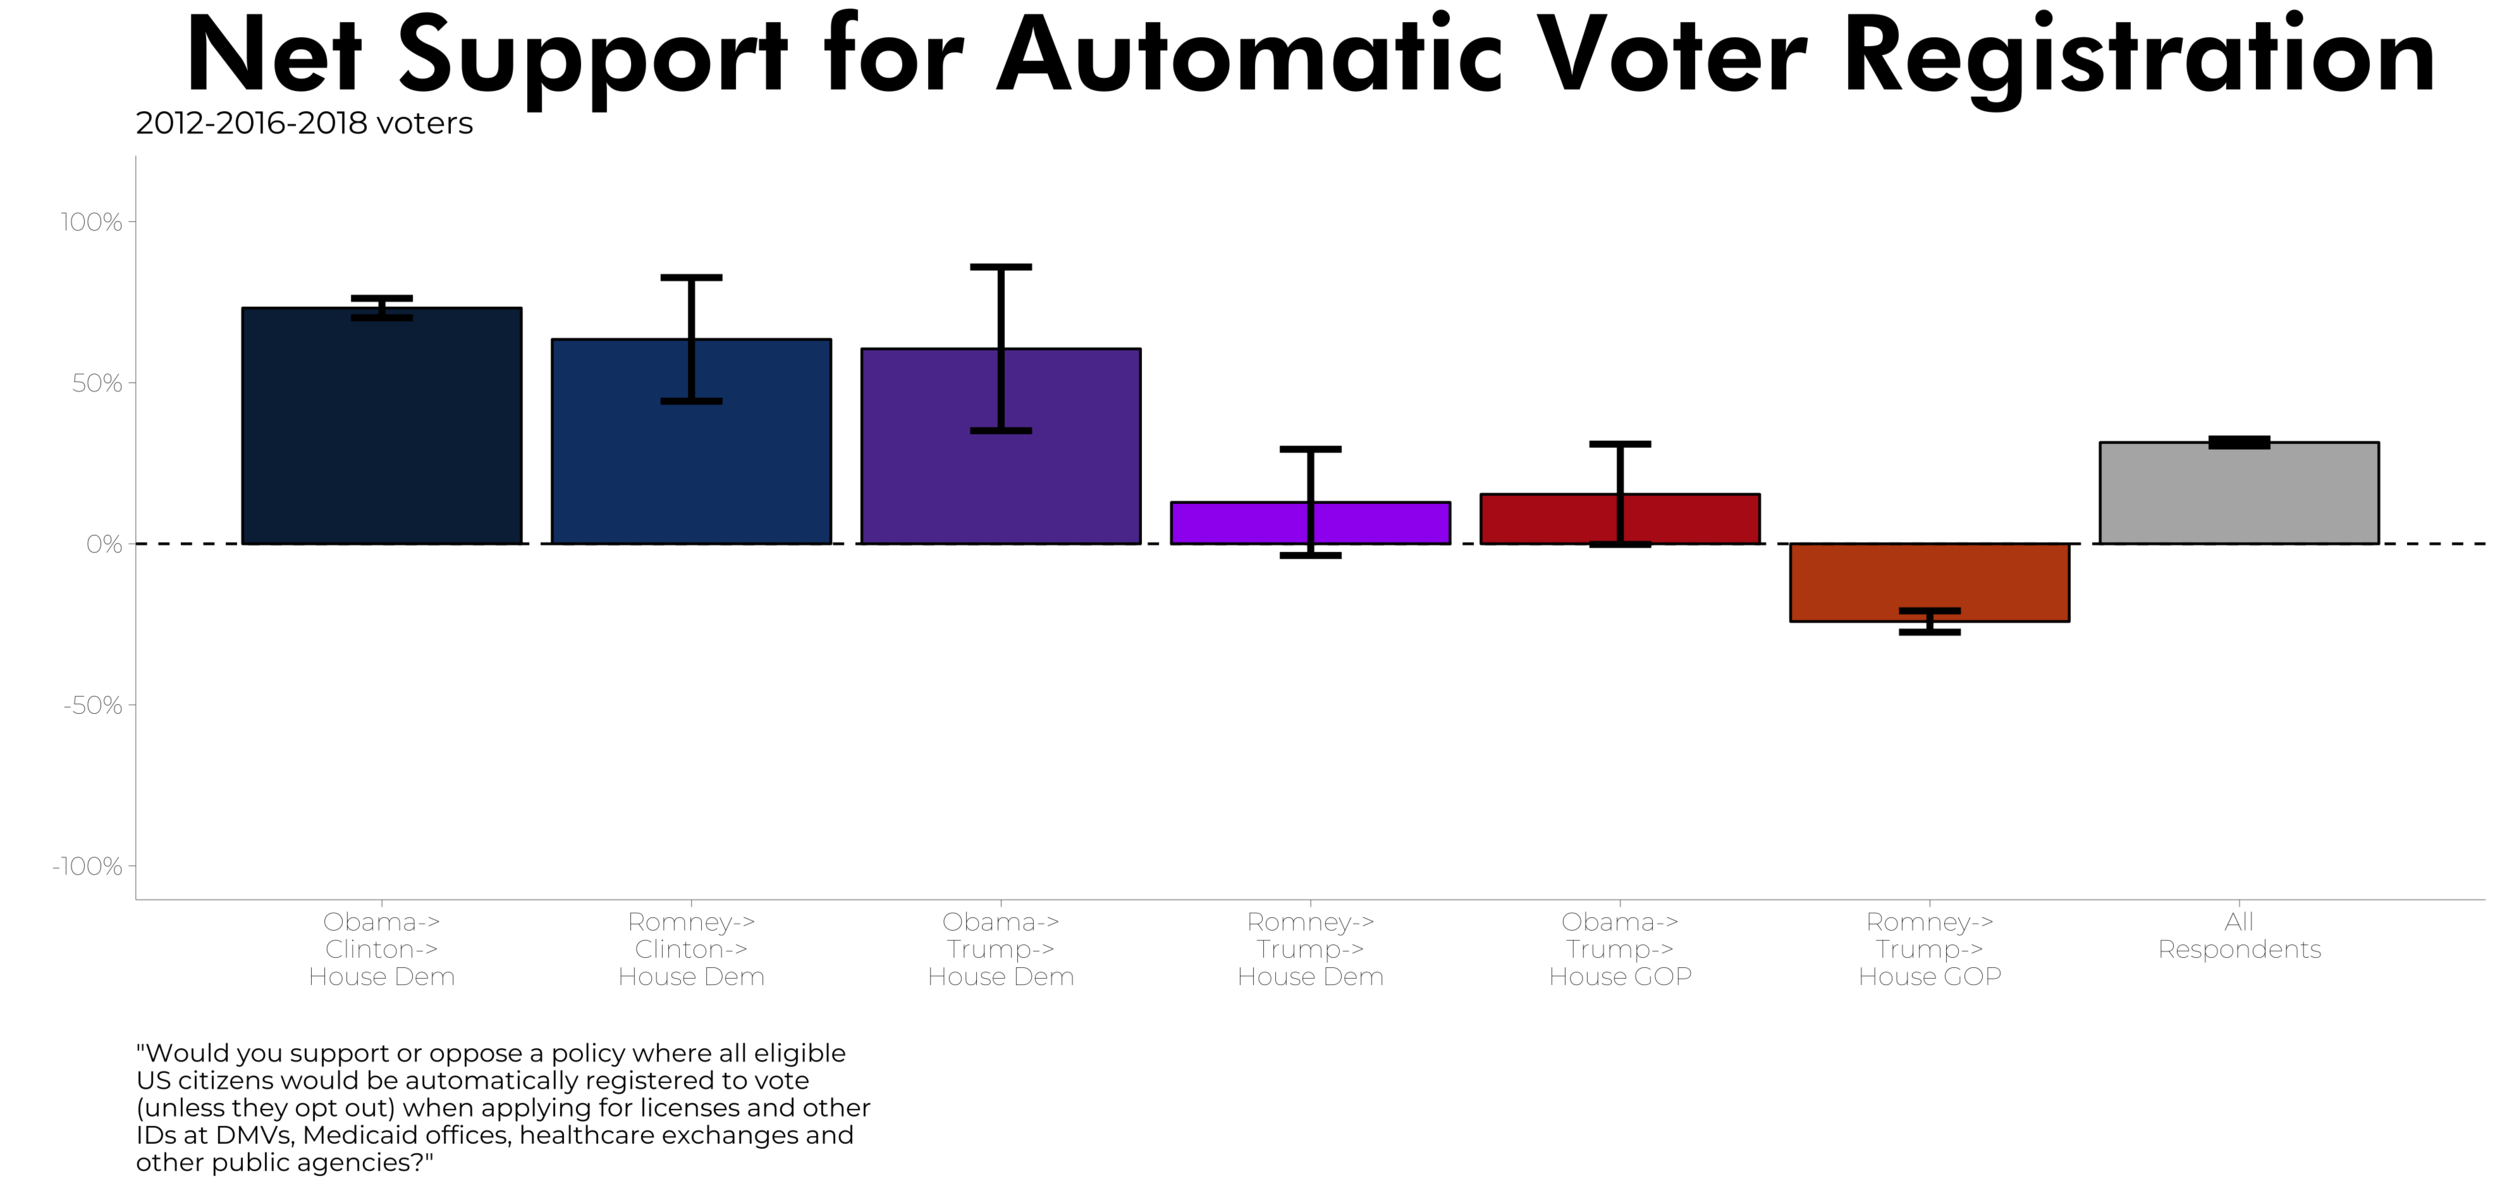
By a 78-5 margin, loyal Democratic voters support a policy to allow all eligible US citizens to be automatically registered to vote unless they opt out, compared to a 29-53 opposition from loyal Republican voters. In the middle, our results weakly suggest that voters who swung to Democrats in 2018 on net support expanding the franchise. Obama-Trump voters who supported a Democratic House candidate in the 2018 midterms on net support automatic voter registration, while Romney-Trump voters who swung Democratic in 2018 are split.
Ending Cash Bail
Similarly, by a 59-12 margin, loyal Democratic voters support ending cash bail for those awaiting trial not deemed to be likely risks for flight or violence compared to a 28-45 margin opposition for loyal Republican voters. Obama-Trump voters who turned back to Democrats in 2018 on net support ending cash bail, while Romney-Trump voters who swung Democratic in 2018 are on the fence.

Building the Wall
Our preliminary results suggest that many voters who swung to Democrats in 2018 are to the right on the issue of border security. While straight Democratic voters oppose increasing border security, including “building a fence along part of the US border with Mexico” by a 66-7 margin, Obama-Trump voters who swung Democratic support increased border security by a 63-12 margin, up to a a 73-13 margin for Romney-Trump voters who swung Democratic in 2018.

Federal Subsidies for All College Tuition
Our results suggest a clear partisan divide on the question of Federal tuition assistance. Our tuition item asked respondents to support or oppose a plan to raise taxes on high-income Americans to cover all college tuition costs and to cap the rise in tuition to the rate of inflation. Loyal Democratic voters supported this plan by a 72-8 margin, compared to 73-14 opposition by loyal Republican voters.
In the middle, Obama-Trump voters who swung to Democrats in 2018 clearly supported such a plan, at an 82-11 margin. Romney-Trump voters who swung toward Democrats, by contrast, were split on the item by a 33-43 margin, which due to the small sample size is not statistically distinguishable from being a tie.

A Green New Deal
We caution that the Green New Deal is a relatively new political frame. With that in mind, we presently find at least some support for the idea across the political spectrum. Our Green New Deal item did not contain the phrase specifically, but did include its proponents’ most agreed-upon feature: a green jobs guarantee. We asked respondents whether they supported or opposed “giving every unemployed American who wants one a job building energy-efficient infrastructure.”
We find net support for a green jobs guarantee among voters in all categories. Indeed, some punditry to this effect motivated early suspicion that Trump might have tried to corner Democratic legislators with an infrastructure plan partially to this effect had he not lacked the political acumen and Mitch McConnell not been so pro-unemployment for the poor.

Pollution fees
Another cornerstone of the Green New Deal, levying pollution fees on business that produce high levels of greenhouse gases, currently enjoys support across the political spectrum. Aside from loyal Republican voters, who are narrowly split on pollution fees 35-40, loyal Democrats through Obama-Trump-2018 Republican voters approve of this item.

Gun Control
Toward the end of our policy battery, we asked a gun control item phrased somewhat differently from most of our other policy items. Rather than asking respondents if they supported or opposed more gun regulations, we asked respondents to evaluate their views on gun regulations on a scale as follows:
Which of the following is closest to your view on gun regulations?
It should be more difficult to buy all types of guns
It should be more difficult to buy some types of guns
The current regulations regarding the purchase of guns are about right
It should be less difficult to buy some types of guns
It should be less difficult to buy all types of guns
With the order of responses rotated so that some respondents saw “less difficult” at the top and others saw “more difficult” at the top.
Perhaps unsurprisingly, partisans were split on the issue of gun control, with recent party switchers split down the middle. Respondents who voted Democratic in the last two or three elections overwhelmingly favor more gun control, while respondents who have voted Republican since at least 2012 overwhelmingly oppose more gun control. We do not have the sample size or narrowness of results to conclude whether Obama-Trump or Romney-Trump voters who swung to Democrats in 2018 support more gun control. Ultimately, voters across our sample on net are ready, if tepidly, to consider new gun regulations.

Abolishing ICE
We asked respondents to consider whether they supported or opposed defunding Immigrations and Custom Enforcement (ICE). Unlike some other items, where we conditioned or caveated the proposed policy change with a general sense of where its costs would be covered or what its implementation might entail, we simply asked whether respondents supported or opposed abolishing ICE.
Respondents across the political spectrum opposed abolition of ICE. While loyal Democrats narrowly supported outright abolition of ICE, every other group of voters on net opposed abolition. We note that while abolition of ICE is typically couched with a reminder that border-related crimes in fact remain crimes with or without ICE, and would be pursued as such by traditional law enforcement agencies at the Federal, state, and local levels, here we simply asked respondents whether they approved or disapproved of outright abolition. That said, there is not presently widespread political support for abolishing ICE.

Medicare for All
Obama-Trump voters who swung back toward Democrats in 2018 supported Medicare for All by a 76-14 margin, which despite the small sample size is statistically distinguishable from being split. Conversely, Romney-Trump voters who swung to Democrats in 2018 oppose Medicare for All by a 53-24 margin. Unsurprisingly, loyal Democrats overwhelmingly support Medicare for All by a 76-3 margin compared to 75-10 opposition by loyal Republicans.

Marijuana Legalization
Similar to other work on the question of marijuana legalization, we find that Democratic voters strongly support its legalization while Republicans narrowly oppose legalization. Voters who swung from Obama to Trump to the Democrats in 2018 support legalization at similar rates to loyal Democrats, as do voters who swung from Obama to Trump and remained Republican voters in 2018. Loyal Republican voters overall oppose the measure, while Romney-Trump voters who swung to the Democrats in 2018 were split on the item, 44-51.

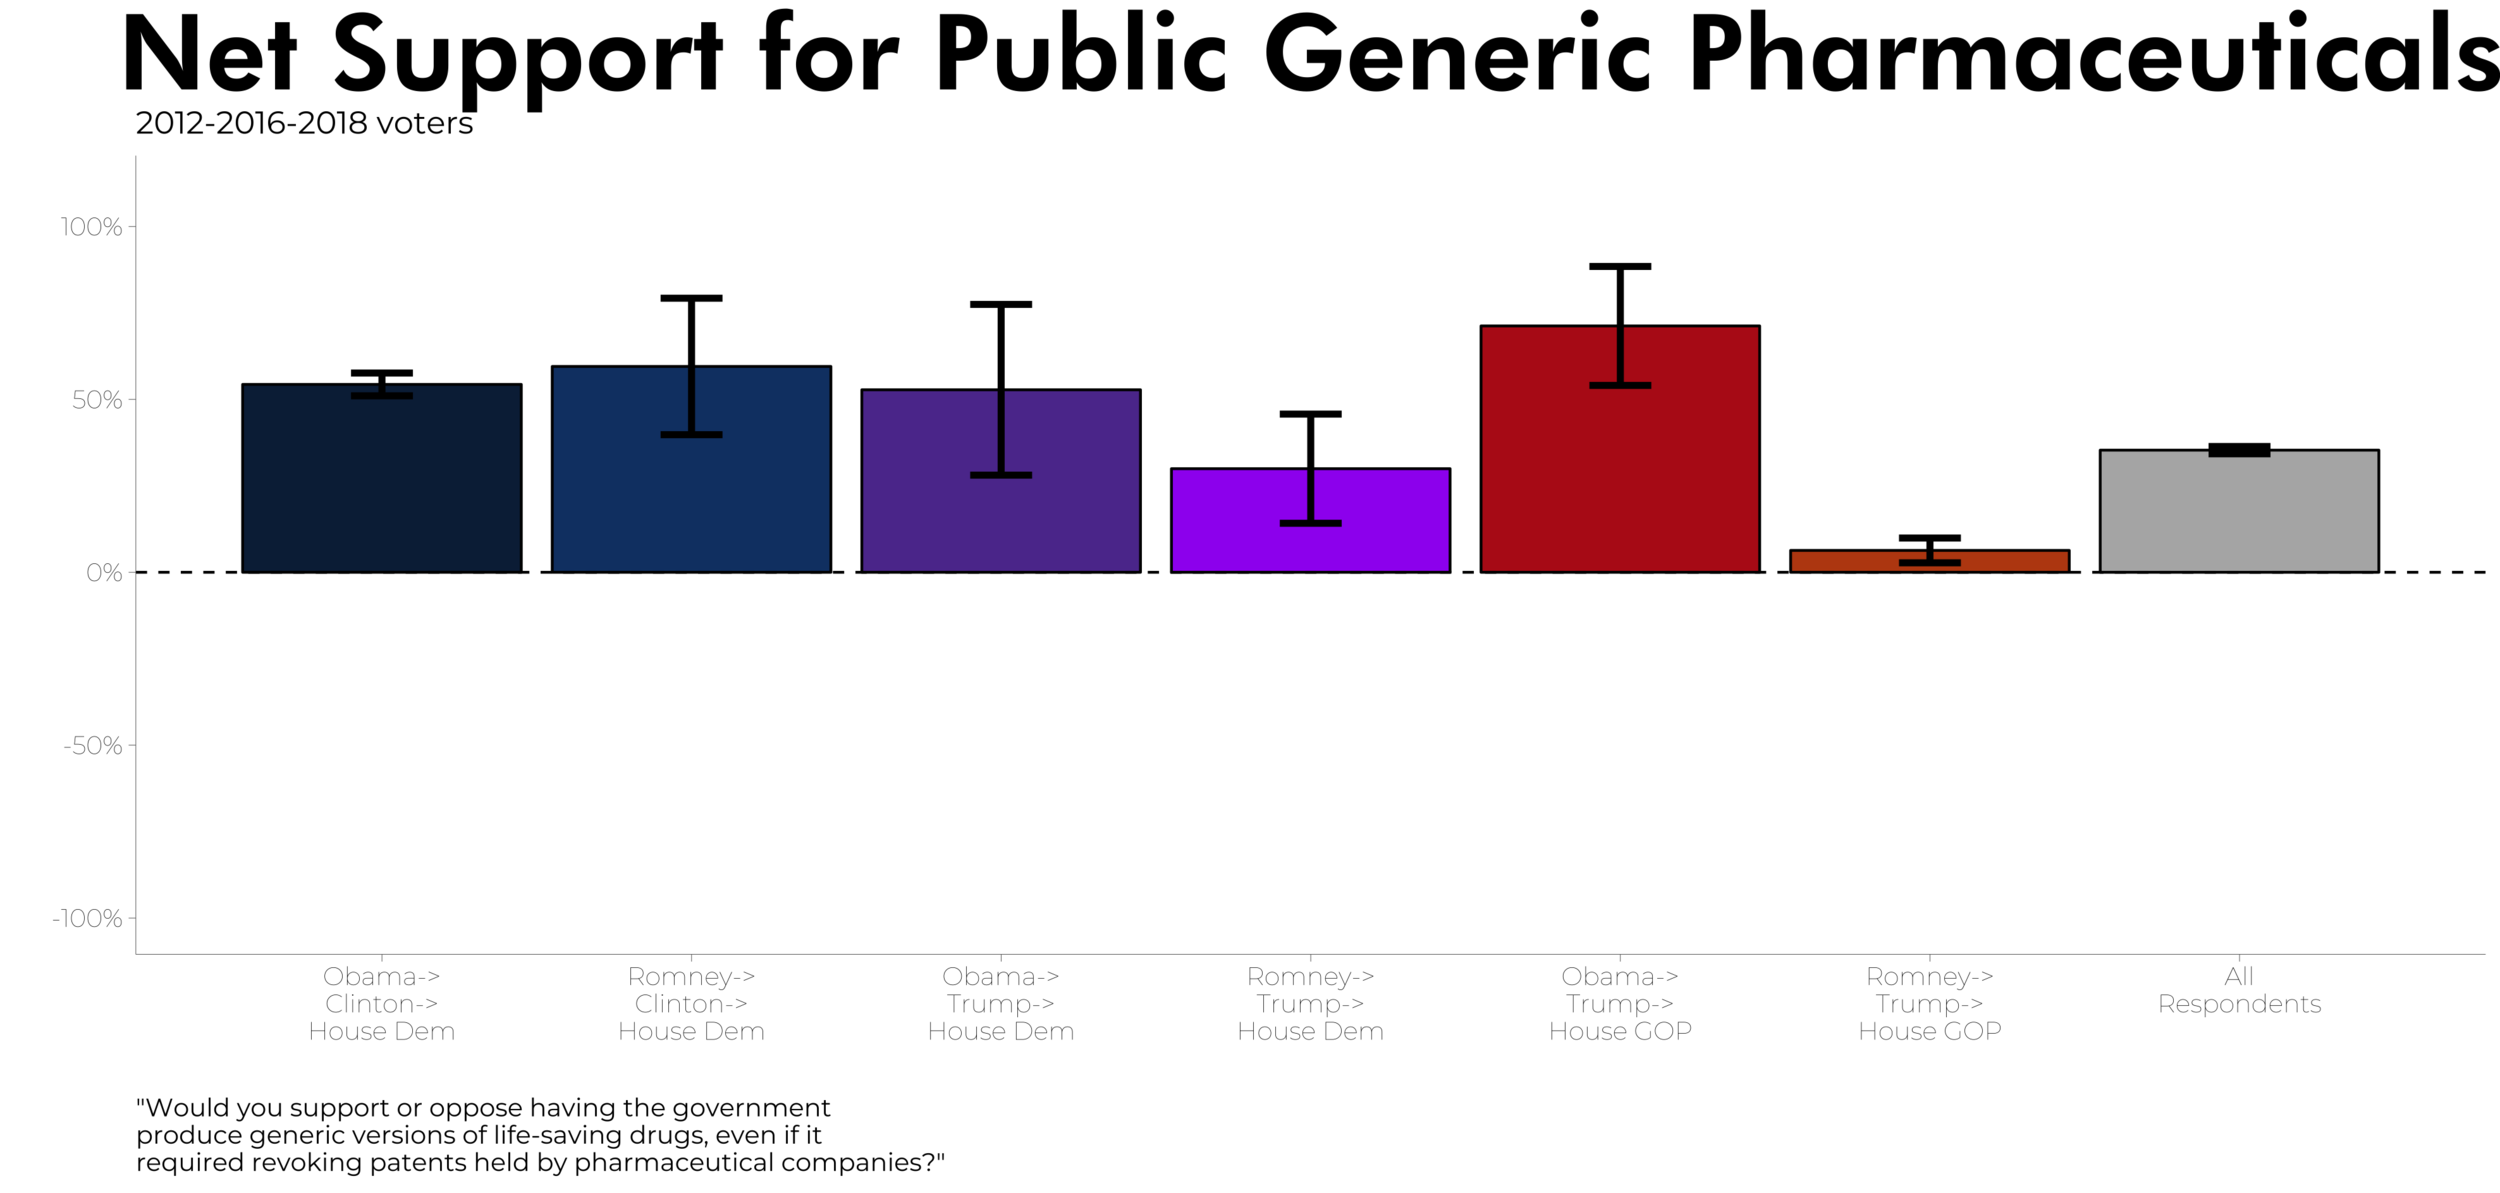
Public Generic Pharmaceuticals
We asked respondents whether they supported or opposed a plan to provide the public with generic pharmaceuticals, “even if it required revoking patents held by pharmaceutical companies.” We found support for generic pharmaceuticals across the political spectrum, which is perhaps surprising considering we asked respondents to weigh the value of public generic drugs against revoking privately-held patents by American businesses. Our previous work on the subject of public generic pharmaceuticals found overwhelming support for the issue as well. Even loyal Republican voters, by statistically significant but substantively narrow 43-36 margin, supported the proposal.
Public Internet Utility
Similar to our previous findings on this subject, we find bipartisan support for the creation of a public Internet utility “to fill coverage gaps in rural, urban, or remote areas that currently lack robust Internet access.” While the idea already has traction in progressive politics and had broad public support as part of President Obama’s National Wireless Initiative, public investment in a wireless utility is currently unlikely under a Republican-led Federal Communications Commission that by and large does not even believe the Internet has public utility-like features.
Voters in our sample disagreed with this assessment. By a 71-3 margin among loyal Democratic voters down to a 38-30 margin among loyal Republican voters, including statistically-distinguishable advantages for the “support” position among each of the swing-voter categories for whom we have enough sample to draw conclusions, voters support the creation of a public Internet utility. Obama-Trump and Romney-Trump voters who swung to Democrats in 2018 both on net reported supporting the idea.

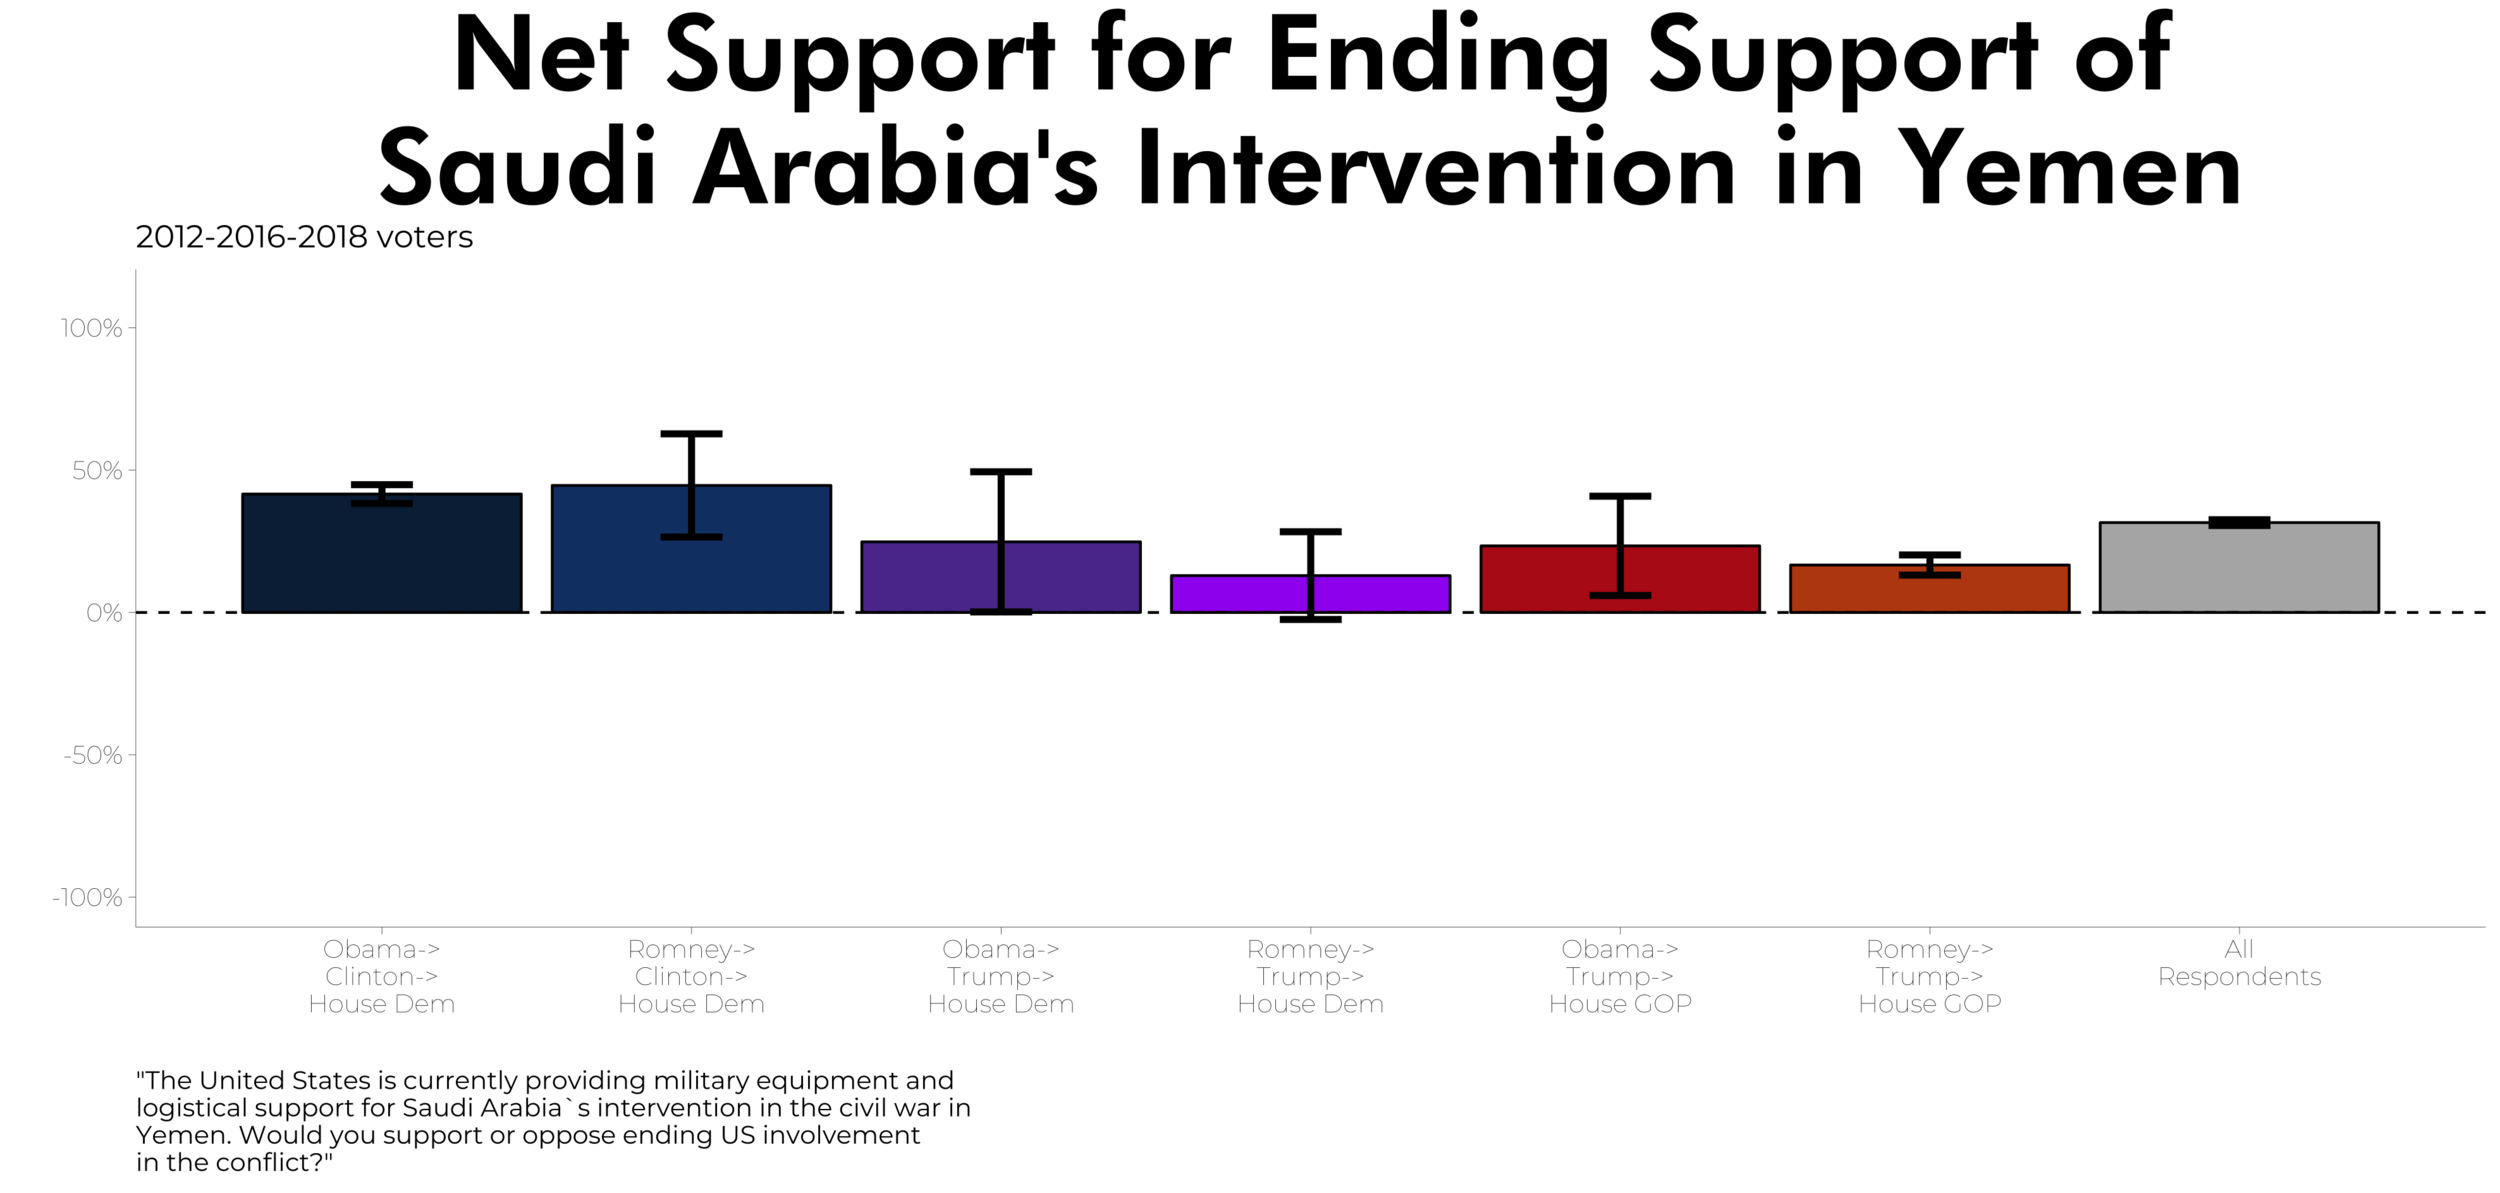
Ending Support for Saudi Arabia’s Intervention in Yemen
As our survey fielded October 27-November 7, respondents were asked to evaluate support for the US-backed Saudi intervention in Yemen before learning that Trump would let Saudi Arabia get away with the murder of a journalist and would let Saudi Arabia continue to commit war crimes and crimes against US residents in exchange for continued bribes in the form of arms sales from politically powerful weapons manufacturers. Thus, respondents on this item lacked the political context now available to us just a few weeks later. Nonetheless, respondents in each voting bin presented here supported ending US backing for the intervention with the exception of Romney-Trump voters who swung to Democrats in 2018 whose result was not statistically distinguishable from being in a tie.
Overall, unsurprisingly, loyal Democrats on net support the progressive agenda we studied here. Perhaps more surprisingly, some fairly ambitious progressive policy goals appealed to loyal Republican voters, and those who voted for Trump then swung to a Democrat in 2018 were amenable to many of these policies on net. Having flipped at least forty seats in the House, seven Governorships, and a half-dozen state legislatures in 2018 with the help of a broad coalition of voters from across the political spectrum, Democrats have no excuse not to pursue a progressive policy agenda going forward.

Curiously, Obama-Trump voters who swung to Democrats in 2018 have a different policy agenda from Romney-Trump voters who swung to Democrats in 2018. While both are skeptical of gun control and want a strongly secure border, they are split on Medicare for All, ending cash bail, and a host of policy priorities like tuition assistance, marijuana legalization, and expanding the franchise through automatic voter registration.
Some of these policies, like the Green New Deal, have yet to enter the public debate broadly, while others, like gun control and Medicare-for-all, have been debated for years. Thus, there is some asymmetry in how much we should expect the public to align with their party’s elites on each. Nevertheless, as it stands, Democrats are (and should be) expected to advance a progressive platform using the power voters have chosen to give them.
Conclusion:
Vote switchers make up a relatively small portion of the electorate, but it’s important to understand their attitudes. We find some evidence that Romney-Clinton voters have similar beliefs to loyal Democrats, and some evidence that Obama-Trump voters who swung back to the Democrats do as well. On issues from hostile sexism and racial animus to concerns about a majority people of color nation, these voters resemble the rest of the Democratic coalition. While more work is needed to focus specifically on persuadable voters, these findings present a road map for future work and for understanding our present context in the aftermath of the 2018 midterms.
John Ray (@johnlray) is a Senior Political Analyst at YouGov Blue.
Alissa Stollwerk (@AlissaStollwerk) is Director of YouGov Blue.
Sean McElwee (@SeanMcElwee) is a co-founder of Data for Progress.
Methodology:
On behalf of Data for Progress, YouGov Blue fielded an online survey between October 27 and November 7, 2018 of a nationally representative sample of 3,215 respondents. The overall survey margin of error was +/- 2 percent. The sample was weighted to the 2018 electorate.
Editor’s Note: An earlier version of several policy plots erroneously included ‘Don’t know’ as an opposition position. These have been corrected from the version of this post released the morning of November 29. This error affected the apparent levels of support for the plots of the Medicare for All, gun control, abolishing ICE, border security, and tuition assistance plots, as well as the final summary plot of overall support for each policy by group.