Populism and Racial Animus in the 2018 Midterms
By John Ray (@johnlray) and Sean McElwee (@SeanMcElwee)
Summary
Media narratives often present Trump’s success as the product of a populist politics. Since his election, many rust-belt diners have had their breakfast interrupted by reporters eager to suss out the secret to Trump’s success. Here we present results from our What The Hell Happened Survey of 3,215 voters, weighted to be nationally representative of the electorate using Catalist’s voter file. We find that racial animus, not populism, predicts support for Trump in 2016 and Congressional Republicans in 2018. We also find that Obama-Trump voters are motivated in part by populism but also racial animus, and the voters who moved back into the Democratic column in 2018 were also more populist than Obama-Trump voters who did not.
Populism and Partisan Vote Choice
Respondents in Data for Progress’ What The Hell Happened? survey were asked several items drawn from a well-tested set of items in the academic literature designed to measure populist sentiment. Specifically, our populism items asked respondents to indicate the whether they agreed or disagreed with the following statements:
It doesn't really matter who you vote for because the rich control both political parties.
The system is stacked against people like me.
I'd rather put my trust in the wisdom of ordinary people than in the opinions of experts and intellectuals.
In political science there is some debate as to whether populism or racial animus was the prime motivator of support for Donald Trump in the 2016 election. Including popular and validated measures of both populism and racial animus permit us to test which of the two factors was the stronger predictor of Trump vote choice in 2016 and House vote choice in 2018.
To measure racial animus, we built a similar scale out of responses to items in our survey that academics use to measure racist attitudes. We drew from a variety of different political science measures of racism, specifically, we asked respondents to “indicate the extent to which [they] agree with each of the following statements.”*
Generations of slavery and discrimination have created conditions that make it difficult for African Americans to work their way out of the lower class.
I am angry that racism exists.
Irish, Italian, Jewish, and many other minorities overcame prejudice and worked their way up. Blacks should do the same without any special favors.
Racial problems in the U.S. are rare, isolated situations.
White people in the U.S. have certain advantages because of the color of their skin.
For each statement, respondents were asked to strongly agree, somewhat agree, neither agree nor disagree, somewhat disagree, strongly disagree or if they had no opinion. For the “Generations of slavery…,” “I am angry…,” and “White people in the U.S….” items, the “strongly disagree” position is the position associated with higher levels of racial animus, while the “strongly agree” position is associated with lower levels of racial animus. For the “Irish, Italian, Jewish,....” and “Racial problems in the U.S….” items, the “strongly agree” position is the position associated with higher levels of racial animus.
To compare the importance of these two underlying constructs in predicting 2016 vote choice for Donald Trump and Congressional Republicans in 2018, we included both our populism scale and our racial animus scale in a multivariate general linear model along with “usual suspects” demographic and political variables including party ID, sex, race, education, family income, and age, and weights to represent the 2018 electorate. The results presented here are robust to recoding party ID as a two-way, three-way, or the full Strong Democrat through Strong Republican 7-point scale, and the same is true concerning the various recoding options for the race, education, income, and age. We ran the same analysis to predict 2016 Trump vote choice for the full sample, Millennials, and non-Millennials, and 2018 House vote choice for the full sample, millennials, and non-millennials.
The following charts present predicted probabilities of voting for Trump in 2016 or voting for a House Republican in 2018 by change in the racial animus scale. In each pane, the predicted probabilities are presented for change in the racial animus scale holding numeric variables to their mean, and categorical variables to their modal values.
In contrast, the populism scale was generally a less successful predictor of vote for Trump in 2016 or a House Republican candidate in 2018. The coefficient on the populism scale was statistically insignificant and substantively null, with a one-point change on the three-point populism scale associated with a 0.7 percent increased chance of voting for Trump (+/- 0.04).

Plot includes the data (the dots at 0 and 1), and conditional means along each level of the scale

Plot includes the data (the dots at 0 and 1), and conditional means along each level of the scale
We briefly summarize in the following charts. Across the full sample, racial animus was a significant and positive predictor of both Trump vote choice in 2016 and House Republican vote choice in 2018. On a five-point racial animus scale, controlling for the demographic and political covariates listed above, moving up one point on the scale is associated with about an 18 percent increase in the chance of voting for Trump in 2016, and about a 17 percent increase in the chance of voting for a House Republican candidate in 2018. Among millennials, a one-point increase in the racial animus scale is associated with a roughly 15 percent increase in the chance of voting for Trump in 2016 and a 19 percent increase in the chance of voting for a House Republican in 2018.
Across the models for which House 2018 vote was the predictor of interest, however, the populism model was negatively correlated with House Republican vote choice across the full sample. On a populism scale ranging from zero to three, a one-point increase in a respondent’s level of agreement with populism-oriented statements was associated with about a 0.13 decrease in the probability of voting for a House Republican candidate in 2018. A similar effect did not hold within the non-millennial and millennial subsamples. Among the non-millennials in our sample, a one-point increase in the populism scale was associated with a statistically significant but substantively marginal 0.1 +/- .05 predicted decrease in probability of voting for a House candidate in 2018. Among millennials, changes in the populism scale were not significantly nor substantively associated with partisan vote choice in 2018 House races.

Plot includes the data (the dots at 0 and 1), and conditional means along each level of the scale

Plot includes the data (the dots at 0 and 1), and conditional means along each level of the scale
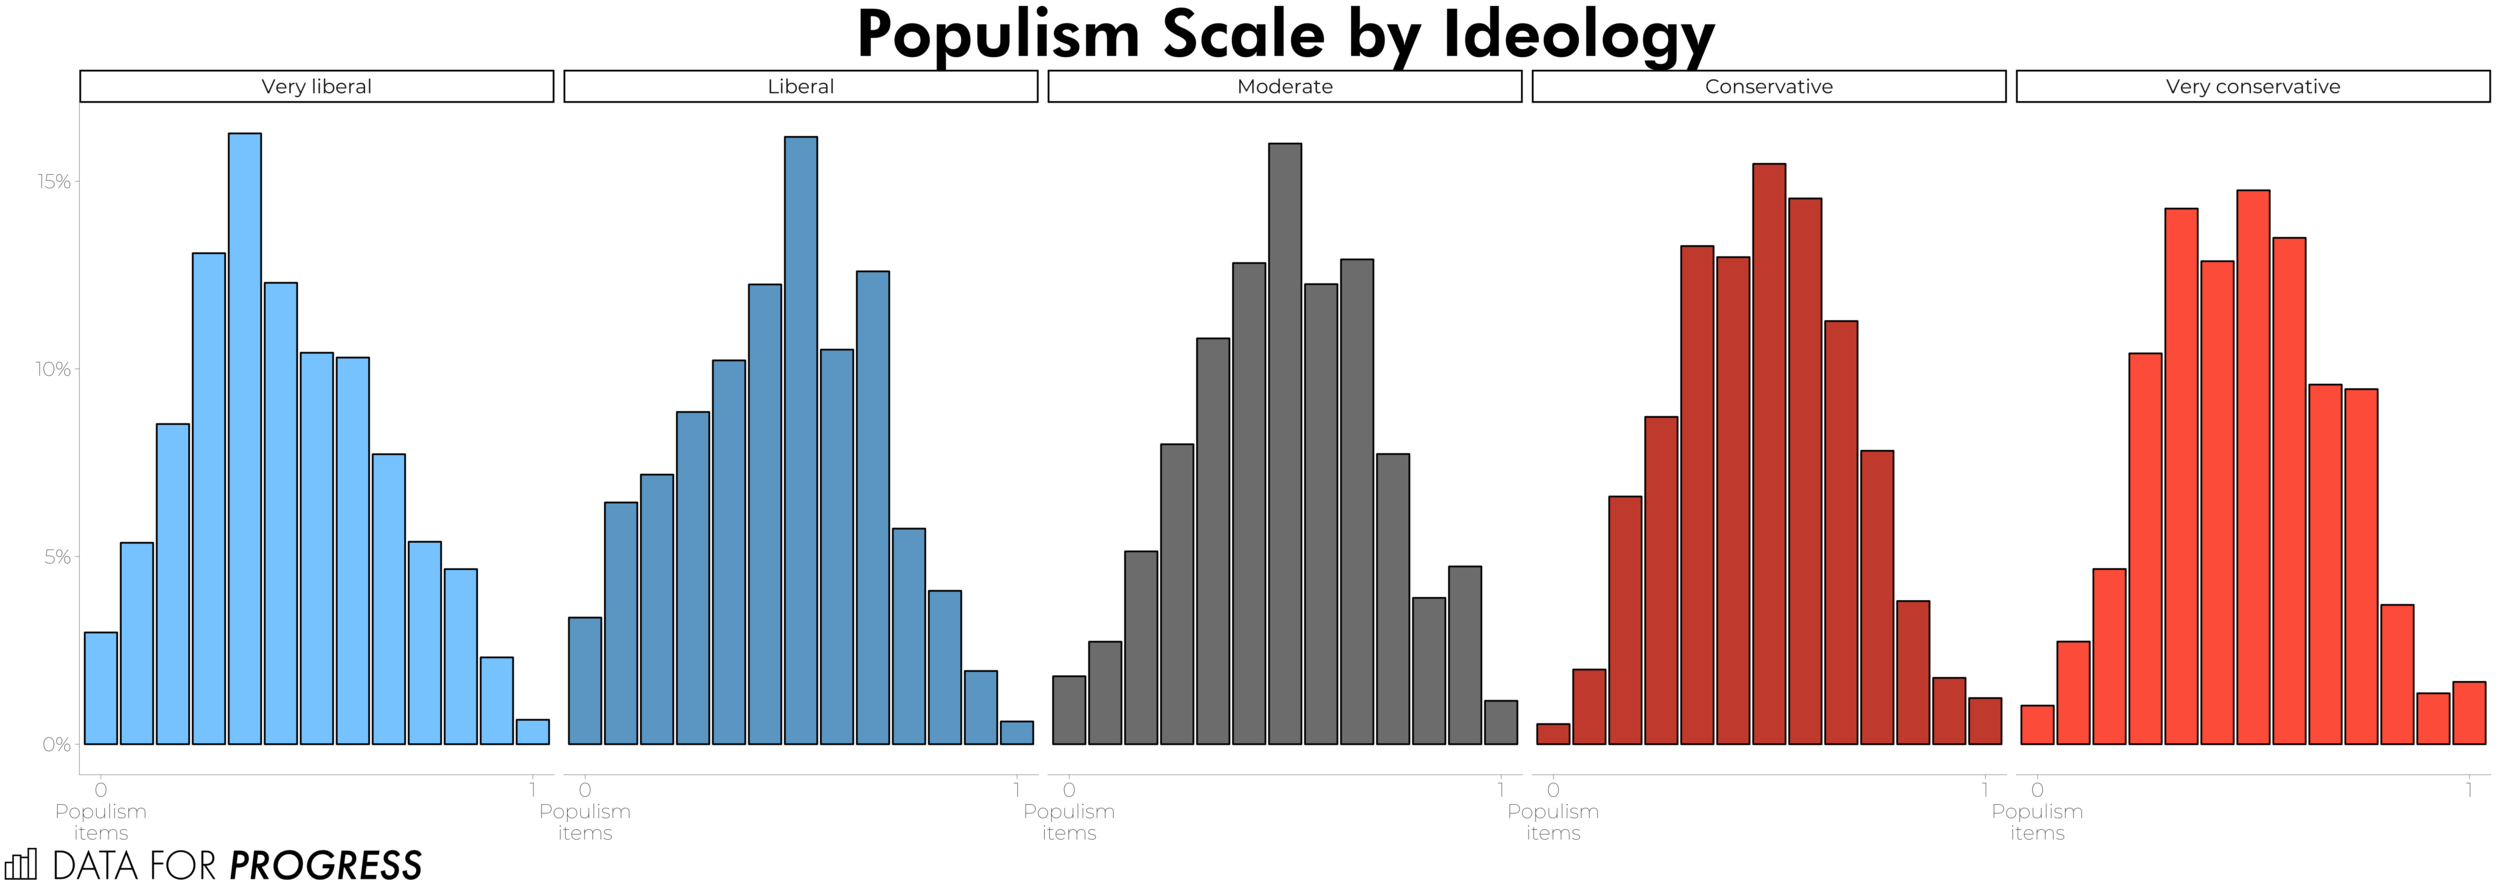
Across the ideological spectrum of the sample, respondents reported generally similar average levels of support for populism. We caution that this does not mean that populism means the same thing to those on the political left or the right -- left populism and right populism are very different things, while our scale simply taps into some elements that are common to both sides of populism. Future work will have to further untangle the differences in how populism manifests on left and right.
Despite some belief that Trump is a “populist candidate,” supporters who bear an ideological similarity to the president are not significantly more populist than those who are of other self-reported ideologies. Across the ideological spectrum, there is little overall variation in the level of populism. Respondents who identified as “Very liberal,” “Moderate,” and “Very conservative” each averaged about a 5 out of 12 on the scale, +/1.2 for “Very liberal” and “Very conservative” respondents, and about 6 +/- 1.2 for “Moderate” respondents.
The following plots demonstrate the breakdown of the populism scale across the ideological spectrum of respondents in our survey. The distribution of self-reported populism across this spectrum does not vary much from Very liberal through Very conservative. We find a similar distribution even if we recode and rework our populism scale a variety of ways.** Neither end of the ideological spectrum is the exclusive home of those with populist values.
Correlates of Populism: Do the rich have too much, too little, or about the right amount? How about the poor?
In addition to skepticism of elites and a belief in grassroots political power, one common element of populism is the belief that the rich have too much wealth and power. Later in our survey, after the populism items, respondents were asked how they felt about the low and high ends of the national income distribution. Specifically, respondents were asked two items, in random order:
For each of the following groups, please say whether most people in the group have more money than they deserve, less money than they deserve, or about the right amount of money:
Poor people
Rich people
For each of these items, respondents were asked to report whether they believed each of these groups had “A lot more money than they deserve,” “Somewhat more money than they deserve,” “Slightly more money than they deserve,” “About the right amount of money,” “Slightly less money than they deserve,” “Somewhat less money than they deserve,” or “A lot less than they deserve.” Across political and demographic breakdowns in our sample, virtually no one reported believing that the poor had “too much,” nor that the rich had “too little.” Perhaps unsurprisingly, the divide between liberals and conservatives, and between those who voted Democrat and those who voted Republican in 2018, are similar. Specifically, liberals and Democratic voters reported believing that the rich have too much and the poor have too little, while conservatives and Republicans reported believing that both the rich and the poor have “about the right amount.”
The following figure plots the results for each item by 2018 House vote choice. The pane on the left compares respondents who voted for a Democratic House candidate to those who voted for a Republican House candidate on whether the rich have too much, about the right amount, or too little. The pane on the right compares those groups’ responses for whether the poor have too much, about the right amount or too little. Those who voted for a Republican in 2018 tended to report believing both the rich and the poor have “about the right amount”, a strong endorsement of the status quo. By contrast, those who voted for a Democrat in 2018 tended to report believing that the rich had “too much,” and reporting they believed the poor had “too little.”


This difference in breakdown across the vote choice spectrum is not consistent with the narrative that the Republican Party is home to populist economic ideas, since overwhelmingly, Republican voters believe that the rich and the poor both have what they deserve. Had populism been a stronger motivator of Republican beliefs, we would expect to see more widespread belief that the rich have too much, and the poor too little.
Populism and Obama-Trump Democrats
While we do not find any evidence that conservatism is the home of populism in 2018, we find some evidence that populist rhetoric played an important role in conservative politics in 2016. Populism is a set of values shared across the political spectrum, and Trump is widely believed to have effectively deployed populist rhetoric in 2016 against a Democratic candidate who did not. Our results suggest it is reasonable to speculate on the value of populist appeals in bringing voters back to the Democratic column in 2020.
If we return to the models ran above, and set the dependent variable to be “switched from voting for President Obama in 2012 to voting for Trump in 2016,” and subset the population to Democrats, we find a significant and positive role for both racism and populism in supporting Trump. Democratic respondents’ placement on the populism scale was a significant predictor of being a voter who supported President Obama in 2012 but supported Donald Trump in 2016, and the same for their racial animus scores. For this result, we included the same set of demographic “usual suspects” as above.

Plot includes the data (the dots at 0 and 1), and conditional means along each level of the scale

Plot includes the raw conditional means along each level of the scale
The effect is substantively smaller for Obama-Trump voting than it is for other voting behavior in 2018, with a one-item increase in the populism scale being associated with about a 4 percent increased chance of being an Obama-Trump voter, and a one-item increase in the racial animus scale being associated with about a 3 percent increase in the chance of being an Obama-Trump voter.
We caution against overinterpreting this result as our total sample of 3,215 only included 99 Obama-Trump voters in total. Nonetheless, the positive association between these two items suggests that Trump’s populist appeals in 2016 were successful in attracting some Democratic voters. Compared with a self-styled technocratic candidate like Hillary Clinton, it is not surprising that we see this small but significant relationship between voters’ populist preferences and their voting preferences.
Our topline result for populism across the ideological spectrum suggests that many voters left, right, and center hold at least some populist views. From that perspective, it is reasonable for some voters to have chosen the candidate they believed better represented those views than a candidate generally viewed as more technocratic. In our vote switchers analysis published recently, we found that vote switchers, generally speaking, held more populist values than either loyal Democrats or loyal Republicans.
This result provides some indication of a way forward for Democrats. In his time in office, Trump has proved he is a plutocrat with no concern for the poor, who is obsessed with his private wealth, and gleefully revels in ceding the lawmaking process to unelected elites send to him from secretive right-wing think tanks, from the swamps of white nationalism, and from the membership rolls of the exclusive country club resort from which he was hatched. In addition to betraying basic Constitutional principles, the rule of law, and the spirit of American democracy, Trump must also be called out for deliberately thwarting the will and the needs of ordinary people.
Indeed, if we return to the items asking respondents whether the rich and poor have too much or too little, and subset to just Obama-Trump voters, we find numbers consistent with the theory that populism was part of Trump’s appeal to voters across the political spectrum. In the following plots, the red line in each plot represents Obama-Trump voters who voted for a Republican House candidate in 2018, the blue line represents Obama-Trump voters who voted for a Democratic House candidate in 2018, and the gray line represents all voters. Obama-Trump-House GOP voters, while still expressing lower levels of belief that the poor have too little and the rich have too much than the total sample, express much beliefs at higher rates than Republicans overall, as shown above.


Conclusion:
Our analysis suggests that there is very little reason to believe that populism drove support for Trump in 2016 or Congressional Democrats in 2018. Racial animus is a much stronger predictor of partisan vote choice than populism. However, there is some evidence that Obama-Trump voters were motivated by populism, though as with past research, we find racism predicts Obama-Trump voting.
Author’s note: Due to reader requests, each of the predicted probability plots in this post were updated to include raw conditional means of the data at each level of the x-y axis pairs in their respective plots. This was done so that readers could more easily see how the regression lines correspond to what would actually be observed in the raw data. These edits are for aesthetic convenience and did not change any results or conclusions already reported.
John L. Ray (@johnlray) is Senior Political Analyst at YouGov Blue.
Sean McElwee (@SeanMcElwee) is a co-founder of Data for Progress.
Methodology:
As part of our What The Hell Happened Project, Data for Progress commissioned a survey of 3,215 voters from YouGov Blue that was fielded October 27th through November 7th, which was weighted to be nationally representative of 2018 voters. The survey margin of error was +/-2%.
* The items in each battery were asked in random order, and were presented here alphabetically.
** For example, these results are robust to only including various subsets of our three populist items, to recoding.