
Nativism Isn’t Going Away
Immigration Attitudes Continue to Predict Vote Choice
By: Nick Davis (@ntdPhD) and Jon Green (@_Jon_Green)
Groundhog day: Stoking nativist sentiments…again
In late October 2018, stories involving the harrowing journey of Central Americans fleeing violence and extreme poverty began receiving significant news coverage throughout domestic, mainstream media. Shortly thereafter, Donald Trump politicized their trek. Taking to his favored form of communication, he tweeted various comments linking the mostly women and children migrants to criminality and violence, asserting that the situation amounted to “an invasion of our country.” He even promised military action, and, shortly thereafter, the Pentagon would authorize the dispatch of 5,200 troops to the southern border in the ironically-named “Operation Faithful Patriot.”
On the eve of the 2018 midterm elections, it would be difficult to charitably assess the politicization these migrants’ plight as anything other than a naked move to stoke the nativist sentiments that have emboldened the Republican Party. Given the abundant evidence that the interlinked issues of immigration and race served as an important fulcrum in the 2016 election (see: here, here, here), Donald Trump’s return to the well of nativist rhetoric was a familiar, if not calculated play. However, the extent to which immigration preferences successfully motivated self-reported voting behavior in the 2018 midterms is an open question.
What is nativism? And why does it matter?
As a suite of attitudes involving immigration (legal or otherwise), nativism is something of an amorphous psychometric construct (see: here for a good explainer). It can conceivably involve rational beliefs rooted in economic self-interest. If an influx of immigrants are perceived as a labor market threat, then native workers might react negatively towards the prospect of being displaced. Alternatively, nativism can involve negative reactions against immigrants who might displace cultural or social norms regardless of their material or economic implications; in this version, anti-immigrant sentiment more closely resembles raw prejudice.
In either version, the key ingredient with respect to “negative” attitudes toward non-natives involves perceptions of threat. Put simply, if immigrants might threaten material well-being or social status, then native persons may hold negative attitudes toward them. The problem, of course, regards the manner in which these sorts of attitudes are expressed and, more importantly, the ends to which they lead. Coherent immigration policy that takes seriously the idea that 10 million undocumented workers cannot live in limbo in perpetuity and values notions of law and order is one thing. Insinuating immigrants are “rapists” or “thugs” or “invaders” is another – and is precisely the sort of dehumanizing rhetoric that usually paves the way for mass atrocity. This issue is not just academic; it has real consequences.
Nativism and vote choice in the 2018 midterms
To test the strength of the relationship between nativist attitudes and vote choice, we use recent data collected by Data for Progress (DfP) in partnership with YouGov Blue. Our nationally-representative sample consists of slightly over 3,000 respondents. Population estimates are weighted to the results of the 2018 election.
Data for Progress fielded number of questions suitable for operationalizing nativism. In particular, we isolated eight items that explicitly made reference to immigrants, which we list in Table 1. These items vary across a spectrum of ideas, incorporating social status threat (Customs, Speak, Enrich), security or physical threat (Border, Deport), and economic threat (Services, Jobs). There was also a question about naturalization (Path).
Table 1. Immigration-related instruments on DfP-YouGov post-election survey
Please indicate the extent to which you agree with each of the following statements…
[Customs] The growing number of newcomers from other countries threatens traditional American customs and values.
[Speak] It bothers me when I come in contact with immigrants who speak little or no English.
[Path] Provide a path to citizenship for some undocumented immigrants who agree to return to their home country for a period of time and pay substantial fines.
[Border] Increase border security by building a fence along part of the US border with Mexico.
[Deport] Deport undocumented immigrants to their native countries.
As you may know, Census projections show that by 2043 African Americans, Latinos, Asians, and other mixed racial and ethnic groups will together be a majority of the population. Thinking about the likely impact of this coming demographic change, how much do you agree or disagree with each of these statements?
[Enrich] Americans will learn more from one another and be enriched by exposure to many different cultures.
[Services] There will be too many demands on government services.
[Jobs] There will not be enough jobs for everybody.
Notes: Responses to each item have been recoded to range from 1 “strongly disagree” to 5 “strongly agree.” “Don’t know” responses have been recoded to neutral midpoint.
Figure 1 presents the relationship between these items using a correlogram, or a plot that visually illustrates the extent to which these items are related. Perhaps unsurprisingly, we find that all of the instruments share a significant amount of variance, and an exploratory factor analysis reveals that, save for the naturalization question (Path), the items load extremely well onto a common factor.
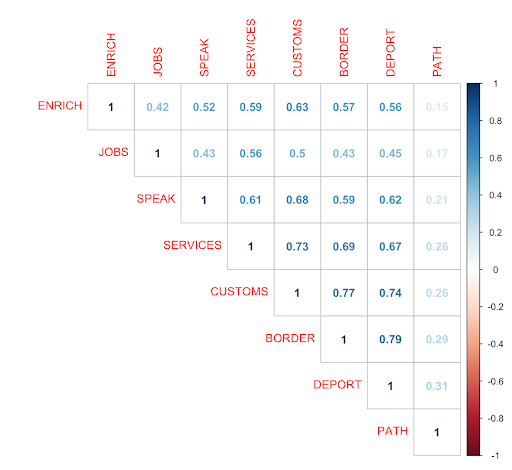
Figure 1. Pearson's correlation coefficients for nativism items. Larger (smaller) values and darker (lighter) colors convey stronger (weaker) relationships among items. Subsequent factor analysis excludes "Path.”
We plot the distribution of scores on this factor in Figure 2. We also break these scores out by partisanship. In Figure 2A, there appears to be significant variation in nativism. However, as Figure 2B illustrates, the variation is almost wholly a function of predictable political orientations. Republicans and Democrats’ scores are inverted across the range of the scale. In other words, ideas concerning assimilation, culture, and economic demands of immigration are polarized along partisan lines.

Figure 2. Nativism factor scores. Factor includes seven survey questions listed in Table 1: Customs, Speak, Border, Deport, Enrich, Services, and Jobs.
Next, we assess the strength of the relationship between nativism and vote choice. We begin by testing how nativism predicts recalled vote choice from the 2016 presidential election in Figure 3. Here, point estimates convey the marginal effect of differing degrees of nativism (arrayed along the x-axis) on vote choice for Donald Trump (y-axis). In addition, the superimposed histogram gives the reader some sense of the actual distribution of nativism scores. As the point estimates indicate, moving from low values (left-side of the x-axis) to high values of nativism (right-side of the x-axis) results in a substantial increase in the probability of casting a vote for Donald Trump, all else equal.

Figure 3. Predicted probability of casting a vote for a Republican candidate in 2016 (Trump) and 2018 (House member). DV is self-reported vote choice. Models include covariates for partisanship, ideology, race, born-again status, and hostile sexism attitudes. Point estimates bracketed by 95% confidence intervals. Distribution of nativism scores among all respondents has been superimposed to facilitate interpretation.
However, as these predicted probabilities reveal, the relationship between nativism and choice is weaker in 2018 relative to 2016. Indeed, while a two standard deviation change in nativism resulted in about a 50 percentage point increase in the probability a voter recalled casting a vote for Trump, the effect is only about 35 percentage points with respect to choice for a Republican candidate in 2016. This asymmetry in the strength of the relationship between nativism and choice for Republican candidates across election cycles is curious. On the one hand, it may be the case that Trump was a quintessential nativist candidate; given that the sample provided by YouGov Blue is nationally-representative, the diffuse nature of combining the House voting choices of many different races with different candidates may blunt nativism’s effect. Alternatively, it may be the case that nativism simply had less purchase on choice in 2018.
To try and push this relationship further to see if we can answer this question, we tested the effect of nativism on the probability that a respondent would cast a vote for a party-consistent candidate. In other words, we attempted to assess whether or not low or high nativist sentiments might release or bind Democrats to Democratic candidates and Republicans to Republican candidates. Figure 4A illustrates the predicted probability of casting a vote for a Democratic House candidate among Democrats at varying levels of nativism. Even at relatively modest levels of nativism, these voters were still loyal to Democratic candidates. Only at the highest levels of nativism are Democrats predicted to have been reasonably likely to have cast votes for non-Democratic candidates -- and the share of Democrats who espoused high levels of nativism is very small.

Figure 4. Party-consistent voting for House member of in-party candidate. Point estimates plotted at +/- one standard deviation in nativism scores. Nativism scores for respective party are plotted via superimposed histogram.
The relationship is more volatile for Republicans, who are predicted to vote for non-Republican candidates about half of the time when they are at the lowest level of nativism. Moreover, Republicans who espouse even modest levels of nativism, as opposed to high levels of nativism, are somewhat likely to cast party-inconsistent votes. This finding is noteworthy because the overall proportion of partisans who voted for the in-party House candidate was roughly 94 percent. While partisanship reliably governs choice, there is meaningful defection among a small group of Republicans with respect to nativist sentiments. Where nativism is sufficiently low, the probability of casting an in-party vote among Republicans decreases markedly.
Finally, Figure 5 illustrates that nativism also corresponds with Independents’ vote choice. We find modest evidence that nativist attitudes effectively push pure Independent voters “over the hump” with respect to selecting a Republican candidate. When paired with the finding that low-nativism Republicans are somewhat less likely to report voting for their party’s candidate, it would seem that Democrats might think carefully about how to peel these voters away from Republican candidates by emphasizing a different vision for immigration-related policies.

Figure 5. Vote choice for Republican candidate among "pure" Independent persons. Point estimates are at +/- one standard deviation in mean nativism. Nativism among all pure Independents is plotted along x-axis. Point estimates bracketed by 95% confidence intervals.
Nativism is a defining feature of the Trump coalition
To be sure, there are limitations with this sort of analysis. Analyzing self-reports are fraught with over-reporting with respect to voting itself, as well as expressive responses. Further, we cannot claim that nativism causes a preference for right-leaning representation. What we can say, however, is that there are important associations between nativism and the intergroup paradigm.
The data here suggest that nativism is a defining feature of the Republican Party coalition during the Donald Trump era. Trump centered nativist themes his presidential campaign, has continued to emphasize nativist issues throughout his administration, and made a nativist conspiracy theory a highly salient issue in the week immediately preceding the election. These dynamics do not appear to have gone unnoticed by the electorate, which is currently polarized by disagreements over who we should welcome and whether new arrivals will change U.S. society for the better. Moreover, this dynamic appears to have alienated a small group of Republicans who take less nativist stances on these questions -- who were more likely to vote against Republican candidates than nativist Democrats were to vote against Democratic candidates (though the numbers of partisans who fell into these groups was small in both cases).
Nativism, at its core, is a rejection of voluntary acceptance and incorporation of non-native, non-citizens into the citizenry. Out-group boundaries are notoriously firm, and threat – whether material or existential – should be sufficient to reject outsiders. Yet, there appears to be an asymmetry with respect to how Republicans and Democrats link these ideas to assumptions or expectations about national identity. Whether this is a unique feature of the present socio-political landscape or a broader fissure within political ideologies, globally, is a pressing question. As the perpetual presidential campaign lurches forward to 2020, it is unlikely that the importance of nativism will fade – particularly given that the singular elite cue to which Republicans look for guidance, Donald Trump, is himself a blustering nativist.
Nick Davis (@ntdPhD) is an Assistant Research Scientist at the Public Policy Research Institute at Texas A&M University. You can find some of his other professional work at nicholastdavis.com.
Jon Green (@_Jon_Green) is a Ph.D. candidate in political science at Ohio State University and a co-founder of Data for Progress.
As part of our What The Hell Happened Project, Data for Progress commissioned a survey of 3,215 voters from YouGov Blue that was fielded October 27th through November 7th, which was weighted to be nationally representative of 2018 voters. The sample was weighted using estimates of the electorate from Catalist, a voter file firm with a lengthy track record of success. We’ve shared this dataset with leading academics and practitioners and will be publishing the results of their analysis as well as our own.