
When Talking About Young Voters, It Is Essential to Analyze Their Attitudes by Race
By Deborah J. Schildkraut (@debbiejsr)
On November 6, 2018, young Americans had one of their highest turnout rates: approximately 31% of 18-29 years olds voted. Accounts that celebrated this news often noted that young voters are considerably more Democratic and liberal than older voters, which could have tipped the balance in some races, such as the Nevada Senate race, and made others closer than they otherwise would have been, such as the Senate race in Texas. Yet as I and others have previously noted, when analyzing young voters, it is critical to examine their attitudes by race, because the left-leaning tendency that they display could be due to the fact that Americans under 30 are a far more racially and ethnically diverse group than Americans over 30.
An important question to consider is whether any of this has changed during Donald Trump’s presidency. Have the past two years led young people of all races to adopt policy preferences that are consistently more liberal than those of their elders? In the analysis described below, I focus on the attitudes of young whites, since it is their views that are most likely to be mischaracterized when young people are cast as overwhelmingly left-leaning. I look primarily at attitudes pertaining to party, ideology, race, and immigration, as those are the topics that have gotten substantial attention from scholars interested in the youth vote.
To conduct this analysis, I ran a simple model that predicts people’s preferences on various questions by their age group (18-29 vs. over 30) and their race (white, non-Hispanic vs. nonwhite). Obviously, there are many other interesting and important ways one could examine this topic (such as comparing young nonwhites with each other by one’s ethnoracial group or adding gender to the mix). This is not meant to be a definitive analysis but rather a first look at what the data show. It is also important to note that the DFP survey was conducted only in English and only with 2018 voters. Since we know that English ability is associated with both political incorporation and more conservative preferences, any differences that I find here between whites and nonwhites are probably even larger in the American population overall. The data analyzed here are only representative of English-speaking voters.
I should also note that I am using a common measure of “youth”: people between the ages of 18 and 29. That means that older Millennials (born between 1980 and 1988) are no longer considered young. It also means that older members of Generation Z (born after 1996) are now included in analyses of young voters (some have taken to calling the 18-29 year old cohort “Millzees”).
So first, let’s look at partisanship, which is measured on a 7-point scale with 4 representing independents and higher number reflecting greater identification with the Republican party. As the graph below shows, young whites are far closer to older whites in their partisan identification than they are to nonwhites of any age. The mean for young whites is ever so slightly in the Democratic camp, but to consider this group solidly Democratic is clearly a stretch. It is nonwhite voters, especially young ones, who are strong Democrats.

On ideology, which is measured on a 5-point scale where 3 represents the moderate category, I do find that both young whites and young nonwhites tend to consider themselves liberal. As the graph below shows, however, it is more accurate to consider young whites as occupying an ideological space in between their nonwhite counterparts and their white elders.

Next, I turned to a racial resentment scale, formed by combining two traditional racial resentment questions: whether people think that generations of slavery and discrimination have made it difficult for African Americans to advance socioeconomically, and whether people think that African Americans today should work their way up without any special favors. On the resulting 5-point scale, a higher score indicates greater resentment. The mean scores depicted in the graph below show that as with ideology, young whites are not aligned with either their nonwhite peers or with older whites. It is noteworthy, however, that the mean scores for all groups are lower than they were in my earlier analysis of the 2012 Cooperation Congressional Election Study (CCES). Perhaps the Trump era has led to an aggregate diminishment of racial resentment, a possibility in line with the “thermostatic” view of public opinion. Clearly, this is a possibility meriting further study.

The pattern that seems to be emerging, with young whites neither as racially or politically conservative as older whites nor as liberal as younger nonwhites, repeats itself when we look at attitudes about the Confederate flag. The DFP survey asked people if the Confederate flag is mostly a symbol of slavery and white supremacy or a symbol of Southern heritage and culture. Below I graph the probability of believing that it is a symbol of Southern heritage and culture. Although young whites are more likely to see it as a symbol of Southern heritage than young nonwhites, overall they were far more likely to say that the flag represents racism. Older whites were the only group that was more likely than not to say it represents Southern heritage.

Next, I created a scale of immigration policy attitudes that combined two questions: whether people support a path to citizenship for undocumented immigrants and whether they support deporting undocumented immigrants. A higher score on this 0-1 scale indicates a support for a more restrictionist approach to immigration policy. As the graph below shows, this is the first issue where we see a real divide between younger and older respondents regardless of race, with older voters having more restrictionist preferences. Both groups of young people are below the midpoint on this scale; both groups of older people are above it. The DFP survey included several other questions related to immigrants and immigration; my preliminary examination of those items (not shown here) indicates a similar pattern.

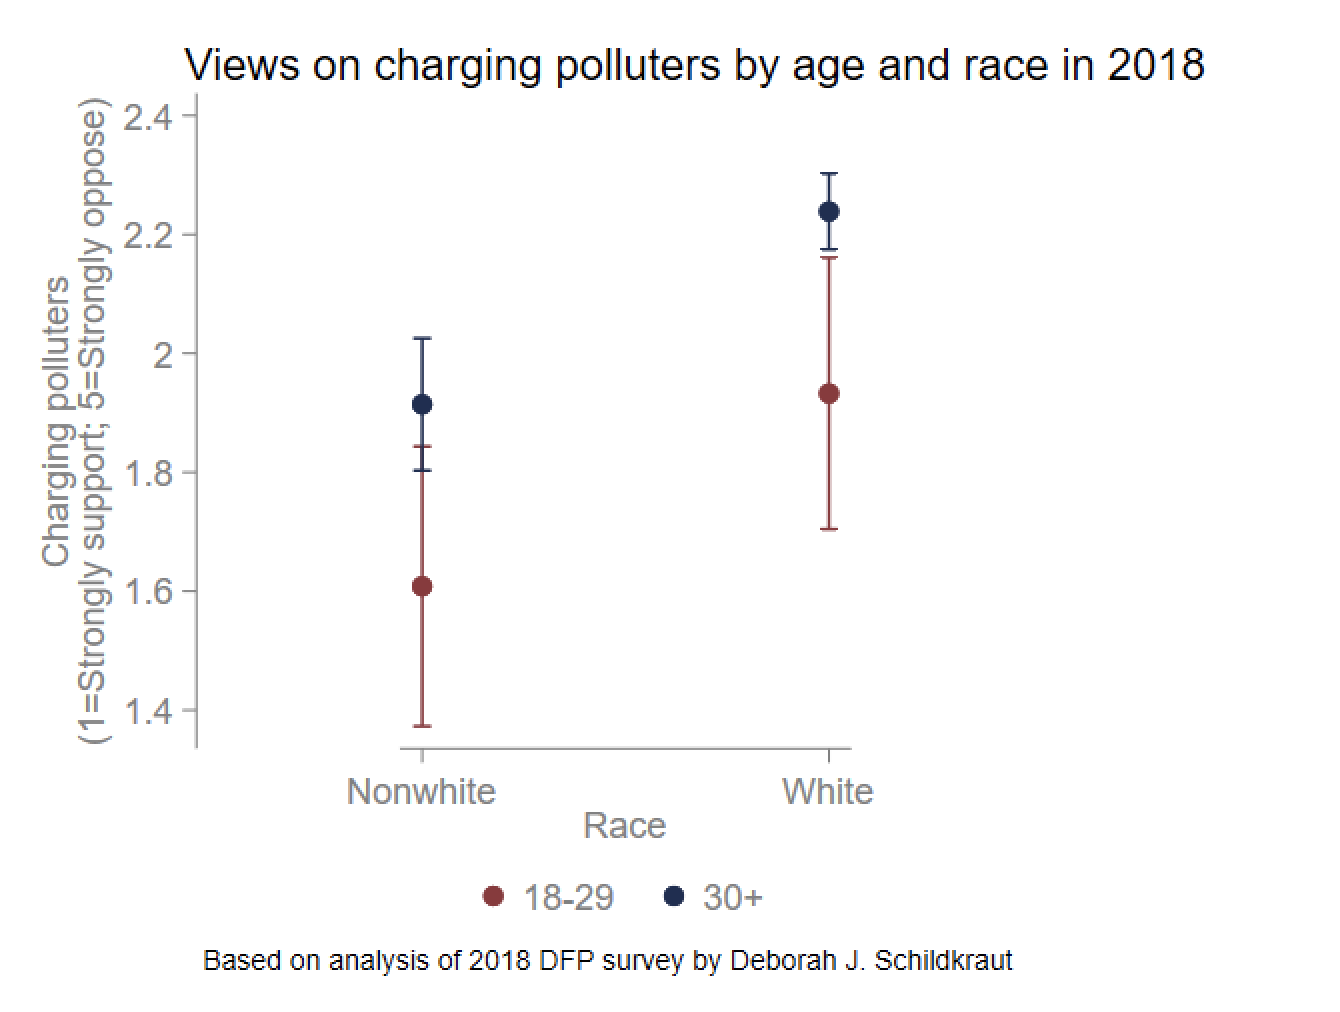
Thus far, it looks like younger whites are indeed becoming more racially liberal when compared to older whites relative to analyses conducted in earlier years, though nontrivial gaps still remain when comparing their views to those of their nonwhite peers. What about on nonracial issues? We hear a lot these days about how motivated young people are by issues like climate change and gun control. Yet one recent study found that Millennials were, surprisingly, not uniquely supportive of big government programs aimed at addressing climate change, nor were they notably more likely to favor stricter gun control policies. That study relied on data from 2015 and 2016. What about in 2018? In the graph below, I examine whether people support or oppose a policy to charge fees on companies that emit high levels of greenhouse gasses. A higher score indicates greater opposition to this policy. This graph looks like many I have already shown: the leftward tendency of young voters is strongly driven by young nonwhite voters (though do note that all groups here are below the midpoint on the 5-point scale, indicating broad support for this policy).
Finally, let’s look at gun control, where people were asked if it should be more difficult to buy all types of guns (or some types of guns), whether current policies are sufficient, or whether it should be less difficult to buy all types of guns (or some types of guns). A higher score means people think buying guns should be easier. Yet again, young whites are not as conservative as older whites, but they are far from the mean view of their nonwhite peers. Interestingly, on this and on other issues depicted here white voters between 18-29 years old look most like nonwhites over the age of 30!

Overall, then, it is clear that there is great heterogeneity of attitudes among young voters. Although it appears that on some issues young whites in 2018 are to the left of young whites analyzed in recent years, there are still many areas in which they are in between other young people and older whites. Based on this analysis, I continue to believe that it is a mistake to talk about the political leanings of “young people” without qualifying which young people one has in mind. In some instances, notably the Confederate flag and immigration, younger whites resemble younger nonwhites more so than they resemble older whites. But on many other issues pertaining to race – and especially on partisanship – race remains a key factor shaping the attitudes of young people. This is true of ostensibly non race-related policies as well, like gun control. Put simply, be wary of any big headlines that proclaim the liberalness of America’s youth. Much of that liberalness is still driven by the fact that younger Americans are much less likely to be white than older Americans.
Deborah J. Schildkraut (@debbiejsr) is a professor of political science at Tufts University.
As part of our What The Hell Happened Project, Data for Progress commissioned a survey of 3,215 voters from YouGov Blue that was fielded October 27th through November 7th, which was weighted to be nationally representative of 2018 voters. The sample was weighted using estimates of the electorate from Catalist, a voter file firm with a lengthy track record of success. We’ve shared this dataset with leading academics and practitioners and will be publishing the results of their analysis as well as our own.